In most English-speaking property markets, an investor's first instinct is to pull comparable closed transaction prices. In the United States, agents check MLS "sold" data before setting an asking rent; in the United Kingdom, the Land Registry publishes actual sale prices; in Australia and Singapore, portals such as CoreLogic or URA track recently settled prices and rents. Japan has no direct equivalent of a public, searchable database of actual rents achieved or actual leasing fees paid. There is no MLS-style closed-transaction registry for residential rentals, and no government portal where you can look up what the unit down the street actually rented for last month. Owners, and even many local agents, estimate vacancy costs and recruiting budgets from experience rather than from a number anyone can simply look up.
This is the first thing an international investor in Japanese rental housing should understand, because it reframes the whole article: the industry-survey data assembled below is about as close as the Japanese market gets to a "comps" database for tenant-recruiting economics, and the scarcity of public transaction data is itself a defining, and somewhat surprising, feature of how Japanese rental property is bought, managed, and let. Everything that follows is built from real survey numbers precisely because there is no official alternative.
With that context in place, here is the practical question every owner of Japanese rental property has to answer before writing a single line of ad copy or booking a single viewing: how much are you willing to pay, per vacancy turnover, to get the unit filled? This article is written for owners of Japanese apartment and small residential buildings — most commonly low-rise, wood-frame multi-unit properties called ippanmura apāto in the data below — and it uses 2026 primary-source data to lay out, in real yen amounts, the cost of one vacancy cycle, the legal ceiling on advertising fees ("AD," pronounced as the English letters) and brokerage commissions, and which of four common tactics — cutting rent, offering free rent, paying a higher ad fee, or simply letting a unit sit vacant — actually costs the most. Every yen figure is converted to an approximate USD amount (at roughly ¥150/USD, as of 2026-08) so investors thinking in dollars can follow the arithmetic without a calculator.
Key takeaways
- For a typical wood-frame apartment building (national average), one vacancy turnover lasts about 1.5 months. At the national average full-occupancy rent of ¥66,156 (approx. USD 441) per unit, that is roughly ¥99,000 (approx. USD 660) lost per turnover.
- By law, the combined compensation a real-estate brokerage can collect from landlord and tenant for arranging a lease is capped at 1.1x one month's rent. For residential leases, the default cap on what can be collected from the tenant alone is 0.55x.
- An advertising fee ("AD") can be paid on top of that legal cap, as reimbursement for the actual cost of advertising specifically requested by the owner — it is a separate budget line, not an extension of the commission cap.
- For properties classified as long-vacant under a 2024 rule change, the combined compensation cap rises to 2.2x one month's rent — effective July 1, 2024.
- A 5% rent cut, held for Japan's average tenancy length of 6.0 years, costs ¥238,176 (approx. USD 1,588) in lost income — more than either one month of free rent (¥66,156 / approx. USD 441) or one extra month of AD.
The Bottom Line: Set Your Recruiting Budget by the Cost of One Turnover
Nine-tenths of a tenant-recruiting decision comes down to three numbers. The first is the vacancy loss per turnover — what one empty period actually costs you. The second is the legal ceiling on what you're allowed to pay a broker in compensation and advertising fees. The third is the cumulative income lost if you cut rent instead. Once these three numbers are lined up side by side, the conclusion becomes visible as arithmetic rather than opinion: paying an extra month of AD to fill a vacancy two months sooner is, in almost every realistic case, far cheaper than lowering the rent.
Unlike a market where a leasing agent might simply tell you "the going rate for AD here is one month," this article builds the three numbers from named primary sources: the joint survey by the Institute of Real Estate Management Japan (IREM JAPAN) and the Japan Association of Rental Housing Management (公益財団法人日本賃貸住宅管理協会), Japan's Ministry of Land, Infrastructure, Transport and Tourism (国土交通省, MLIT) fee notification and housing-market survey, and the Ministry of Internal Affairs and Communications (総務省) housing and land survey. The choice between open listings and exclusive listings — a question every owner eventually faces — is placed after these numbers deliberately, because if the terminology comes first, the decision quietly becomes about definitions instead of dollars and cents.
Japan's 2026 Rental Market: 4.436 Million Vacant Rental Units as the Starting Point
How hard it is to fill your vacancy has less to do with your own effort than with how many competing empty units exist in your market. Roughly half of all vacant housing in Japan is not abandoned stock or an unsold new-build or someone's unused vacation home — it is rental housing actively being marketed for tenants, exactly like yours. Starting from this number changes what a recruiting budget is actually buying: not just an advertisement, but a faster exit from a very large, very real competitive pool.
49.3% of Japan's 9.002 Million Vacant Homes Are For Rent — 78.5% in Multi-Unit Buildings
According to the Statistics Bureau of Japan's (総務省統計局) "2023 Housing and Land Survey" (令和5年住宅・土地統計調査), released in preliminary form in September 2024, Japan's total housing stock stood at 65.047 million units, of which 9.002 million were vacant — a vacancy rate of 13.8%, the highest on record. Of those vacant units, 4.436 million, or 49.3% of all vacant housing, were vacant rental units being actively marketed. Broken down by building type, the share is even higher for multi-unit apartment buildings: of 5.029 million vacant units in multi-unit buildings, 78.5% (3.947 million) were vacant rentals.
For a reader used to US, UK, or Australian vacancy statistics — where "vacant housing" more often means seasonal, derelict, or between-owner stock — this is a useful recalibration: in Japan, when you hear a striking vacancy-rate headline, roughly half of what is being counted is simply apartments and houses like yours, sitting on the market waiting for a tenant. Filling your unit one month faster is not an abstract efficiency gain; it is one month less time spent competing against 3.947 million other advertised units in multi-unit buildings alone.
Rents Are Rising: Average Monthly Rent Is ¥59,656 (approx. USD 398), Up 7.1% in Five Years
The same survey found that the average monthly rent for a rented home (excluding utilities) was ¥59,656 (approx. USD 398), up 7.1% from 2018. By construction type, wood-frame private rentals averaged ¥54,409 (approx. USD 363, +4.5%), and non-wood-frame private rentals averaged ¥68,548 (approx. USD 457, +7.0%). Rented homes totaled 19.462 million units, or 35.0% of all housing, of which private rentals accounted for 15.684 million units (28.2%).
So the backdrop is two things at once: heavy competition (millions of vacant units chasing the same renters) and rising rents. That combination is exactly why it is worth pausing before defaulting to a rent cut to fill a vacancy — a rent cut moves against the direction the market itself is heading, and, as later sections show, its cost compounds for as long as the tenant stays.
The Real Cost of One Vacancy Turnover, in Actual Yen
This is where the article gets concrete. If you don't yet have your own building's numbers, start by plugging in the national averages below and running the same calculation on your own rent roll. The figures come from the 13th (2025) National Rental Housing Survey (第13回(2025年版)全国賃貸住宅実態調査報告書) jointly conducted by IREM JAPAN and the Japan Association of Rental Housing Management — a survey covering 3,844 properties nationwide with 40,979 valid responses — specifically its indicators for wood-frame, single-building rental properties nationwide.
| Indicator (wood-frame, single building / nationwide) | Value | What it means |
|---|---|---|
| Full-occupancy monthly rent | ¥66,156 / unit (approx. USD 441) | Monthly income when one unit is fully occupied |
| Vacancy rate | 2.09% | Calculated as: units vacated × average vacancy period |
| Vacancy loss | ¥987 / unit / month (approx. USD 6.6) | Monthly income lost to vacancy |
| Operating expenses | ¥10,761 / unit / month (approx. USD 72) | Monthly management, repair, and insurance costs |
| Expense ratio / NOI ratio | 17.79% / 81.62% | Operating expenses and net operating income as a share of revenue |
| Average turnover rate | 16.7% | Share of units that change tenants in one year |
| Average tenancy length | 6.0 years | Average years a single tenant stays |
| Recruiting costs (AD, advertising fees, leasing commissions, etc.) | Average ¥17,670 / unit / year (approx. USD 118) Median ¥13,260 (approx. USD 88) / Kanto ¥22,525 (approx. USD 150) | Annual amount spent on tenant recruiting |
| Property-management fee rate (PM fee) | Average 4.49% (median 5.00%) | Rate charged for management outsourcing |
| Repair and maintenance costs | ¥49,965 / unit / year (approx. USD 333; 7.8% of full-occupancy rent) | Maintenance costs including move-out restoration |
Source: IREM JAPAN / Japan Association of Rental Housing Management (公益財団法人日本賃貸住宅管理協会), "13th (2025) National Rental Housing Survey" (For the Kanto region specifically: average turnover rate 19.5%, average tenancy length 5.1 years, full-occupancy monthly rent ¥69,677 / approx. USD 465)
Readers used to US or UK property management reporting, where "vacancy rate" is usually a simple point-in-time occupancy percentage, should note that this 2.09% figure is a different kind of number: it is units vacated multiplied by average vacancy period, a flow-based measure rather than a snapshot. That distinction matters for the next calculation, because it's what lets you back out the actual number of months a unit typically sits empty.
One Turnover Averages About 1.5 Months of Vacancy — a Loss of Roughly ¥99,000 (approx. USD 661)
The survey defines its vacancy rate as "units vacated × average vacancy period." Working that definition backward, dividing the national wood-frame vacancy rate (2.09%) by the average turnover rate (16.7%) gives the average vacancy period per turnover.
- 2.09% ÷ 16.7% = 0.125 years = approximately 1.5 months
- ¥66,156 (approx. USD 441) full-occupancy rent × 1.5 months = approximately ¥99,234 (approx. USD 661) lost per turnover
- For the Kanto region: 1.97% ÷ 19.5% = approximately 1.2 months; at a rent of ¥69,677 (approx. USD 465), that is approximately ¥84,000 (approx. USD 560)
What matters here is the structure more than the dollar amount. The higher a region's turnover rate, the more frequently units turn over, so shortening the turnover period compounds every single year. Kanto's average tenancy is 5.1 years against a national average of 6.0 years, which means Kanto properties carry a heavier annual burden for the same vacancy period. (Note: the above figures are derived by working backward from the survey's published indicators; they are not stated directly in the source report.)
A 10-Unit Building's Annual P&L — and What It's Worth to Fill Vacancies One Month Faster
Breaking down one year of operations for a 10-unit, wood-frame apartment building at the national average:
| Item | Calculation | Annual amount |
|---|---|---|
| Full-occupancy rent | ¥66,156 × 10 units × 12 months | ¥7,938,720 (approx. USD 52,925) |
| Vacancy loss | ¥987 × 10 units × 12 months | −¥118,440 (approx. −USD 790) |
| Operating expenses | ¥10,761 × 10 units × 12 months | −¥1,291,320 (approx. −USD 8,609) |
| Net | — | ¥6,528,960 (approx. USD 43,526) |
| (Reference) Survey average NOI ratio | — | 81.62% |
At a 16.7% turnover rate, roughly 1.7 of the 10 units change tenants in a given year. If you can shorten the vacancy period per turnover from 1.5 months to 1.0 month, that recovers ¥66,156 × 0.5 months × 1.7 units = approximately ¥56,000 (approx. USD 373) per year. That is not a large sum on its own, but it recurs every single year, and it flows straight into the property's income-capitalization value at resale. Capitalized at a 5% yield, an annual improvement of ¥56,000 (approx. USD 373) is worth roughly ¥1.12 million (approx. USD 7,467) in asset value — a US or UK investor would recognize this instantly as the same logic behind cap-rate valuation, just applied to a much smaller monthly swing than most Western investors are used to modeling.
The Real Cost of Recruiting (AD + Leasing Commission): About ¥106,000 (approx. USD 705) per Placement
So how much is actually being spent to shorten that turnover period? Because the survey reports recruiting costs (AD, advertising fees, leasing commissions, etc.) as an annual figure, dividing by the turnover rate reveals the per-placement amount.
- Nationwide: ¥17,670 ÷ 16.7% = approximately ¥105,800 (approx. USD 705) per placement = approximately 1.6 months of the ¥66,156 (approx. USD 441) full-occupancy rent
- Kanto: ¥22,525 ÷ 19.5% = approximately ¥115,500 (approx. USD 770) per placement = approximately 1.66 months of the ¥69,677 (approx. USD 465) full-occupancy rent
In other words, the actual market practice is that owners are already spending roughly 1.5 to 1.7 months' rent in recruiting costs per turnover. That lines up reasonably well with the common structural convention of "one month of AD plus the landlord's share of the brokerage commission." Add the 4.49% property-management fee rate (roughly ¥35,600 / approx. USD 237 per year, on ¥66,156 × 12 months) and total leasing-and-management overhead comes to roughly ¥53,000 (approx. USD 353) per unit per year. (This too is an estimate derived from annual indicators.)
What You're Legally Allowed to Pay a Broker Is Set by Law, Not by Negotiation
Before setting a recruiting budget, it helps to know the ceiling. The compensation a licensed real-estate brokerage (宅地建物取引業者, a Japan-licensed real estate agent/broker) can collect is capped by law — specifically, "The Amount of Compensation a Real Estate Broker May Receive in Connection with the Sale, Purchase, or Other Transactions of Land or Buildings" (昭和45年建設省告示第1552号, Ministry of Construction Notification No. 1552 of 1970, most recently amended by MLIT Notification No. 949 of 2024, effective July 1, 2024). This is a fixed statutory ceiling, not a customary market rate — a structural difference from markets such as the US, where brokerage commissions are freely negotiated and typically paid entirely by the landlord/seller side.
| Transaction type | Compensation cap (tax-inclusive) | Notification section |
|---|---|---|
| Brokering a lease | Combined amount from both parties capped at 1.1x one month's rent. For residential buildings, capped at 0.55x from one party alone, unless consent has been obtained at the time of engagement | Section 4 |
| Acting as agent for a lease | Capped at 1.1x one month's rent (combined with any amount received from the counterparty, also capped at 1.1x) | Section 5 |
| Brokering a lease of a long-vacant property | Provided the amount collected from the tenant is within 1.1x (or 0.55x for residential, absent consent), the combined total may reach up to 2.2x one month's rent | Section 9 |
| Acting as agent for a lease of a long-vacant property | Capped at 2.2x one month's rent | Section 10 |
| Advertising fee | An amount equivalent to the cost of advertising specifically requested by the client may be received outside the caps above | Section 11①, proviso |
Source: Ministry of Land, Infrastructure, Transport and Tourism (国土交通省, MLIT), "The Amount of Compensation a Real Estate Broker May Receive in Connection with the Sale, Purchase, or Other Transactions of Land or Buildings" (full text, as amended) / MLIT, Real Estate Brokerage Act-related materials
The Legal Basis for Paying AD (Advertising Fee) Separately — and Its Limits
What is commonly called "one month of AD" or "two months of AD" in practice has a specific legal footing: the proviso to Section 11① of the notification, which allows an amount "equivalent to the cost of advertising specifically requested by the client." The advertising fee is the only item that can be received outside the compensation cap.
It's worth being direct here: the advertising fee is not unlimited. It must correspond to the actual cost of advertising that the client — in this case, the owner — specifically requested. Labeling a payment "advertising fee" in name only, in order to exceed the statutory compensation cap, runs against the intent of the notification. As an owner, the safe and defensible approach — both practically and if ever questioned — is to confirm exactly which portals, for what period, and in what placement your advertising fee is buying, and to pay it as consideration for that specific service. Confirming this takes one question when you engage a leasing agent.
Long-Vacant Properties Can Pay Up to 2.2x — a Rule Effective Since July 2024
Land or buildings that have not been used for residential or business purposes for an extended period, and are not expected to be used again soon, are treated under the notification as a "long-vacant property" (長期の空家等). For such properties, provided the tenant's share stays within the standard cap, the combined compensation for brokering the lease can reach up to 2.2x one month's rent; for an agency arrangement, the cap is 2.2x outright.
For an owner struggling with chronic vacancy, this is a mechanism that effectively doubles the legitimate recruiting budget within the law. If a unit has sat vacant for six months or a year, it is worth asking your leasing agent directly whether the property qualifies for the long-vacant special provision. Eligibility depends on the specific facts, so confirm the details with your licensed brokerage and MLIT's published notification before proceeding.
Rent Cut, Free Rent, Extra AD, or Leaving It Vacant — Which Actually Costs the Most?
The conclusion up front: cutting the rent is the most expensive option of all. Using the national averages of a ¥66,156 (approx. USD 441) full-occupancy rent and a 6.0-year (72-month) average tenancy, here is what each of four common tactics actually costs.
| Tactic | How the cost is calculated | Cost per turnover | Nature of the cost |
|---|---|---|---|
| ① Leave the unit vacant for 1.5 months | ¥66,156 × 1.5 months | ¥99,234 (approx. USD 661) | Recurs every turnover |
| ② One month free rent | ¥66,156 × 1 month | ¥66,156 (approx. USD 441) | One-time only |
| ③ Extra one month of AD | ¥66,156 × 1 month | ¥66,156 (approx. USD 441) | One-time only |
| ④ 5% rent reduction | ¥3,308 × 72 months | ¥238,176 (approx. USD 1,588) | Continues for the entire tenancy |
A ¥3,308 (approx. USD 22) monthly rent cut looks small at the moment you agree to it. But compounded over Japan's average 6.0-year tenancy, it adds up to ¥238,176 (approx. USD 1,588) — 3.6x the cost of one month's free rent, and 2.4x the cost of leaving the unit vacant for 1.5 months. "Just ¥3,000 a month" and "¥238,000 total" are the same decision seen from two different angles; a US or UK landlord weighing a small monthly concession against a lump-sum incentive is making exactly this same trade-off, just usually without seeing the six-year total spelled out.
The Other Reason Not to Cut Rent: It Resets the Baseline for Your Next Tenant, Too
The true cost of a rent cut doesn't end with this tenant's six years. Once you lower the rent, that lower figure becomes the "most recent achieved rent" (直前の成約賃料) used as a reference point for the next round of recruiting, and it feeds into the local market data other landlords and agents use to price comparable units. Raising the rent back up from that new baseline in the next cycle typically requires either capital improvements or a genuinely favorable market shift. A rent cut is not a one-time decision — it is a decision that anchors the property's rent level for the long term. This is a structural difference worth flagging for investors from markets with formal rent-review clauses or CPI-indexed leases: in Japan, there is no automatic mechanism pulling rent back up, so a cut tends to stick.
Before moving rent at all, it's worth first checking the appropriate level by working backward from your target yield. That approach is laid out in How to Set Rent by Working Backward from Investment Yield. For a fuller inventory of tactics besides cutting rent, see 10 Vacancy-Reduction Strategies for an Era of Population Decline.
What Tenants Actually Choose On: FY2025 Housing Market Trend Survey
The raw material for setting recruiting terms should be survey data, not intuition. Here is what households who moved into private rental housing reported, drawn from MLIT's "FY2025 Housing Market Trend Survey" (令和7年度住宅市場動向調査), published July 17, 2026.
| Reason for choosing (multiple answers) | What they compromised on (multiple answers) | What they're dissatisfied with (multiple answers) |
|---|---|---|
| Price/rent was appropriate 45.8% | Price/rent (higher than planned) 28.6% | Price/rent 17.3% |
| Good location/environment 37.6% | Size of the home 17.1% | Bathroom facilities/size 16.1% |
| Transit convenience 34.2% | Layout/number of rooms 15.3% | Kitchen facilities/size 15.3% |
| Close to workplace 27.6% | Kitchen/bathroom facilities/size 13.4% each | Size of the home 14.9% |
| Design/space/facilities 27.3% | Transit convenience 11.5% | Layout/number of rooms 13.2% |
Source: MLIT, "FY2025 Housing Market Trend Survey Report" (令和7年度住宅市場動向調査 報告書) (Press release: July 17, 2026)
Read across these three columns and a recruiting playbook emerges. Tenants choose on rent, compromise on rent, and are still dissatisfied about rent after moving in. But columns two and three are dominated by space, layout, and plumbing/fixtures. That suggests owners don't have to compete purely on rent: if you can improve how spacious and well-equipped a unit appears, there is room to hold your rent line and still get the lease signed — a useful reframe for investors used to markets where rent is treated as the only lever.
The Facilities That Matter Most: Layout (65.8%) and Size (55.3%)
Among reasons tied specifically to facilities and specifications, layout/number of rooms ranked highest at 65.8%, followed by home size (55.3%), kitchen facilities/size (32.9%), design (30.4%), bathroom facilities/size (27.3%), and security features (11.8%). The same survey found that among households in private rental housing, 38.8% had a delivery locker (宅配ボックス) installed, and only 24.9% had a dedicated room usable for remote work; the average age of the dwelling at move-in was 19.9 years.
Layout and square footage are not things you can easily change. But how spacious a unit looks — the floor-plan diagram, furniture-placement suggestions, how the rooms are photographed — is very much something you can change. Practical listing-photography tips are covered in How to Take Listing Photos That Generate Inquiries. A feature like a delivery locker, still installed in barely under 40% of rentals, is a low-cost way to differentiate against otherwise similar competitors at the same price point — a detail that matters more in Japan's dense apartment stock than it typically does for a suburban US single-family rental.
Post-Move-In Complaints Center on Bathrooms (16.1%) and Kitchens (15.3%) — Where to Invest to Reduce Turnover
The fact that bathrooms (16.1%) and kitchens (15.3%) top the dissatisfaction list matters more for retention than for recruiting. If the average tenancy length rises from 6.0 to 7.0 years, the turnover rate falls from 16.7% to 14.3%, and vacancy loss and recruiting costs fall in the same proportion. Investment in plumbing and fixtures is simultaneously a recruiting tool and an investment in reducing turnover itself. Given the roughly ¥200,000 (approx. USD 1,333) combined cost per turnover — ¥99,234 (approx. USD 661) in vacancy loss plus ¥105,800 (approx. USD 705) in recruiting costs — the case for a kitchen or bathroom renovation becomes a concrete, comparable number rather than a vague quality-of-life upgrade.
Nearly Three-Quarters of Tenant Searches Start Online — Internet 62.5% vs. Agencies 42.4%
Per the same survey, 71.5% of households in private rental housing did some of their research online, and 25.9% made an inquiry, attended a briefing, booked a viewing, or requested materials via the internet. Asked how they searched for their unit (multiple answers allowed): internet 62.5%, real estate agencies 42.4%, referral from an acquaintance 12.5%, through their employer 5.1%, and print housing magazines 4.1%.
The internet and the real-estate agency are not competing channels — they are both used together. The now-standard pattern is finding the listing online, then closing the deal at an agency's physical branch. That means owners should check two things: the completeness and photo quality of the listing itself (number of photos, accuracy of condition details such as pet policy, instruments allowed, and the breakdown of move-in costs), and whether the leasing agent's staff can actually speak to the property's specific strengths. The case for running property management and leasing brokerage as one integrated function is covered in The Practical Model for Integrated Management-and-Brokerage Operations to Raise Occupancy.
Electronic Contracts at 2.2%, Online Disclosure at 3.9% — Still an Underused Differentiator
By contrast, electronic-signature contracts remain rare, at just 2.2%; online delivery of the mandatory "Important Matters Explanation" (重要事項説明, a legally required pre-lease disclosure) stands at 3.9%; and property viewings or negotiations conducted over video conferencing sit at 2.5%. For properties targeting relocating employees or students moving from a distance — a segment that skews heavily toward exactly the kind of remote, cross-region search international tenants also do — this remains an area where there is still relatively little competition.
Actual Move-In Costs: Average Rent ¥83,381 (approx. USD 556), Deposits in 51.9% of Cases, Key Money in 43.1%
As material for setting your own terms, it's worth knowing the actual contract figures too. In the FY2025 survey, the average monthly rent for units moved into was ¥83,381 (approx. USD 556; median ¥74,000 / approx. USD 493), with average monthly common-area fees of ¥4,837 (approx. USD 32). A deposit/security deposit (敷金, shikikin) was collected in 51.9% of cases (exactly one month's rent in 64.4% of those); key money (礼金, reikin — a non-refundable payment to the landlord, with no equivalent in most Western leases) was collected in 43.1% of cases (73.4% at one month); and a brokerage commission was charged in 48.0% of cases (69.7% at one month). Combined, 53.9% of respondents said rent felt "a significant burden" or "somewhat of a burden."
This is worth pausing on for readers used to a Western lease structure, where a security deposit is refundable and typically the only upfront cost besides first month's rent: in Japan, key money (礼金) is a customary, non-refundable payment to the landlord on move-in — distinct from the refundable deposit — and roughly 43% of tenants pay it, most commonly one month's rent. That nearly half of tenants pay no key money, and roughly half pay no brokerage commission, shows there is still room to lower the up-front barrier to move-in. Trimming move-in costs lets you lower the entry hurdle without touching the monthly rent at all — keeping your ongoing income intact while still making the unit more accessible. The structure of deposits, key money, and move-in costs is covered further in Understanding Deposits, Key Money, and Move-In Costs.
Open Listing or Exclusive Listing: Choosing by the Numbers
With the numbers above in hand, the next decision is how to structure the listing itself. Japanese leasing uses two listing models — ippan bokai (一般募集, open/non-exclusive listing) and sennin bokai (専任募集, exclusive listing) — and neither is categorically better. The practical rule of thumb: fast-turnover properties should prioritize maximum exposure; slow-turnover properties should prioritize concentrating information and effort with a single agency.
Open Listing: Maximize Exposure by Engaging Multiple Agencies
An open listing means engaging several real estate agencies simultaneously — conceptually similar to a non-exclusive listing arrangement familiar to US or UK landlords, though without a shared MLS backbone tying the agencies' listings together. More agencies means more eyes on the listing and a higher chance of a match, and the owner can also search for tenants directly. The tradeoff is coordination overhead — you must notify every other engaged agency once a lease is signed — and a diffusion-of-effort risk, where no single agency treats the listing as a priority. In fast-turnover, high-demand markets like Kanto (19.5% turnover rate), where inquiries tend to come in regardless, broad exposure tends to translate directly into a shorter time-to-lease.
Exclusive Listing: Concentrate Information and Effort with One Agency
An exclusive listing means engaging a single agency as the sole point of contact — closer to the exclusive-right-to-lease arrangement familiar in many US markets. Communication and reporting are centralized, which reduces the owner's management burden, and the single agency has a stronger incentive to commit advertising budget and staff time. For properties that get only a handful of inquiries a month, properties with a narrow target tenant profile, or properties where you want to concentrate a budget equivalent to two months of AD, an exclusive listing tends to produce better results. The deciding metrics are "inquiries over the last three months" and "the conversion rate from viewing to signed lease." If inquiries are coming in but the unit still isn't leasing, the problem is with the property itself; if inquiries aren't coming in at all, the problem is exposure and terms.
Before Considering Rent Guarantees (Sublease): What to Check First
When vacancy drags on, a rent-guarantee sublease arrangement — known in Japan as sabu-riisu (サブリース, a master-lease structure) — often comes up as an option. Structurally, the owner signs a master lease agreement (特定賃貸借契約, a specified head-lease contract) with a sublease operator, who then sub-lets the units to individual tenants.
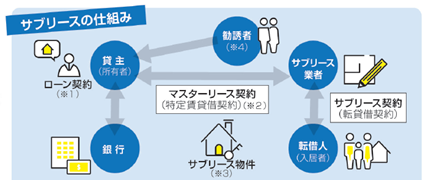
Judging by the numbers built up so far, the comparison is straightforward: weigh the guaranteed rent being offered against what it would cost to run recruiting yourself. If the guaranteed rent is, say, 80–85% of full-occupancy rent, that is a burden of roughly ¥120,000–¥160,000 (approx. USD 800–1,067) per unit per year against a ¥66,156 (approx. USD 441) rent. By comparison, the combined per-turnover cost — ¥99,234 (approx. USD 661) in vacancy loss plus ¥105,800 (approx. USD 705) in recruiting costs, roughly ¥200,000 (approx. USD 1,333) total — spread across the average 6.0-year tenancy works out to only about ¥34,000 (approx. USD 227) per year. Under these assumptions, a property with average turnover economics is actually cheaper to lease yourself than to place under a sublease guarantee. Actual guarantee rates vary by contract, so confirm the guaranteed rent level, the rent-review terms, and any exemption/grace period in writing before signing anything — sublease disputes over unilateral rent reductions have been a recurring source of tenant/landlord friction in Japan, which is part of why this scrutiny matters.
Vetting a Management Company by Registration Status: How to Use the Rental Housing Management Business Act
The quality of your management company is one of the biggest determinants of how a rental investment performs, and track record and reputation are hard to compare directly. Fortunately, Japan's Act on the Proper Management of Rental Housing Business (賃貸住宅管理業法) provides an objective fact anyone can verify today.
Registration Is Mandatory Above 200 Managed Units — 9,987 Registered Operators, 106,678 Qualified Business Managers
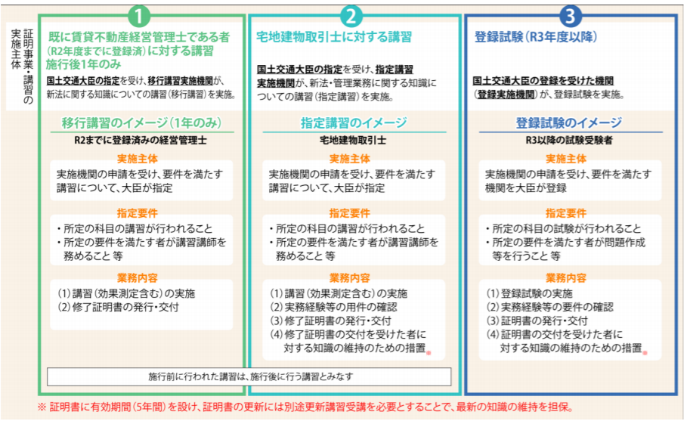
Per MLIT's "Status of Enforcement of the Act on the Proper Management of Rental Housing Business" (賃貸住宅の管理業務等の適正化に関する法律の施行状況), as of July 31, 2025 (令和7年7月31日時点), operators managing 200 or more units are legally required to register with the Minister of Land, Infrastructure, Transport and Tourism. As of that date, 9,987 operators were registered, and 106,678 individuals met the qualification requirements to serve as a business manager (業務管理者). Registered operators are obligated to appoint a business manager, provide a written disclosure of key terms before signing a management-consignment contract (an important-matters explanation), segregate client funds from company funds, and report periodically to the property owner.
As of May 2025, 36.6% of registered operators (3,624 firms) manage fewer than 200 units and are registered voluntarily, with no legal obligation to do so — meaning these smaller firms have chosen to meet the statutory operating standards even though nothing compels them to. Registration alone doesn't determine which company is better, but it is a fact worth checking, and one with no direct US or UK equivalent — most Western jurisdictions have no comparable national public registry of property managers by name.
71.2% of Owners Now Outsource Management; Consumer Complaints Have Risen to 11,359 a Year — 3 Things Not to Just Hand Off
The same source shows the share of rental-property owners who outsource management to a professional operator rose from 25.0% in fiscal 1992 to 71.2% in fiscal 2023. Over the same period, complaints filed with Japan's public consumer-affairs centers (消費生活センター) about management or sublease operators rose from 3,785 in fiscal 2014 to 11,359 in fiscal 2023. Outsourcing has become the norm — precisely why how you choose, and how you stay engaged, now matters more, not less.
There are three things an owner can verify today:
- Registration number: Search MLIT's Rental Housing Management Business Act portal to confirm whether the company is registered, and its registration number.
- Business manager appointment: Ask whether a business manager (業務管理者) is appointed at each branch office, and who holds that role at the office handling your property.
- Substance of periodic reporting: Confirm whether the monthly report includes actual numbers — inquiries received, viewings booked, applications submitted, and days to signed lease.
The third item matters most in practice. A recruiting effort that doesn't report inquiry numbers can't be improved, because you can't diagnose where the process is breaking down. A detailed set of selection criteria is covered in 7 Points for Choosing a Rental Property Management Company, and a contract-review checklist is available in A Checklist for Reviewing Your Property Management Consignment Contract.
Widening Your Tenant Pool: The Revised Housing Safety Net Act (Effective October 1, 2025)
The system for widening the pool of eligible tenants itself has also been updated as of 2026. The revised Housing Safety Net Act (改正住宅セーフティネット法) took effect on October 1, 2025, introducing a new category called residential support housing (居住サポート住宅). This is housing in which a certified housing-support organization (居住支援法人) partners with the landlord to provide daily safety check-ins, periodic welfare visits, and a referral pathway into social-welfare services if a tenant's living or health situation becomes unstable.
Many owners feel uneasy renting to elderly single tenants or to foreign-national tenants, and that unease usually comes down to two specific worries: unpaid rent, and how issues will be handled during the tenancy or at move-out. The revised law introduces a concrete framework addressing exactly those two worries:
- Rent-payment guarantees: A registration and certification system for qualifying rent-guarantee providers, making it easier for eligible tenants to obtain a guarantee.
- Disposal of abandoned belongings: As of October 1, 2025, certified housing-support organizations gained the authority to handle "disposal of belongings left behind, on the tenant's prior instruction" — addressing a legal gray area that has historically made owners nervous about elderly tenants living alone.
- Renovation subsidies: Subsidy programs exist for renovating safety-net-designated housing and residential support housing (amounts and eligibility vary by municipality — check MLIT's program page and your local municipal government for specifics).
Addressing the risk of taking on these tenants through a formal system, rather than through owner goodwill alone, is the most realistic way to widen your addressable pool of renters within a market where 3.947 million multi-unit rental units are competing for the same tenants. The practical use of this system is explored further in How to Use the Housing Safety Net System to Combat Vacancy.
A 7-Point Tenant Recruiting Checklist You Can Act On Today
- Write down your own property's full-occupancy rent, annual number of units vacated, and average vacancy period, and calculate the vacancy loss per turnover in actual yen.
- Using that vacancy loss as your ceiling, decide how much you can spend per turnover on recruiting costs (AD plus your share of the brokerage commission). The national average is roughly 1.6 months' rent.
- Ask your leasing agent for an itemized breakdown of compensation versus advertising fee — which portals, for how long, and in what placement.
- For any unit with a chronic vacancy, ask your agent whether it qualifies for the "long-vacant property" special provision (up to 2.2x monthly rent).
- Before cutting rent, calculate the cut amount multiplied by the average tenancy length, and compare that total against the cost of free rent or extra AD.
- Review your listing photo count and how spacious and well laid-out the unit appears in them. Layout (65.8%) and size (55.3%) top the list of facility-related reasons tenants choose a unit.
- Confirm your management company's three verifiable facts: registration number, business-manager appointment, and whether inquiry volume appears in the monthly report.
FAQ: Tenant Recruiting and Keeping Your Property Full
Q. What's the typical market rate for tenant-recruiting costs, in months of rent?
A. Based on industry-survey figures, roughly 1.5 to 1.7 months' rent per turnover. Dividing the average annual recruiting cost (¥17,670 / approx. USD 118) by the average turnover rate (16.7%) gives approximately ¥105,800 (approx. USD 705) — about 1.6 months of the ¥66,156 (approx. USD 441) full-occupancy rent. In Kanto, that figure is roughly ¥115,500 (approx. USD 770), or about 1.66 months.
Q. How much can I legally pay in AD (advertising fee)? Is there a statutory cap?
A. The compensation cap itself, for brokering a lease, is 1.1x one month's rent combined from landlord and tenant (with residential buildings defaulting to 0.55x from the tenant alone). The advertising fee can be paid separately, on top of that cap, but only for "an amount equivalent to the cost of advertising specifically requested by the client." Labeling a payment "advertising fee" purely to exceed the compensation cap runs against the intent of the notification.
Q. Is there a way to increase my recruiting budget for a chronically vacant property?
A. Under the fee notification amended effective July 1, 2024, leases of a "long-vacant property" can carry compensation up to a combined 2.2x one month's rent when brokered, or up to 2.2x when handled as an agency arrangement. Eligibility is decided case by case, so confirm with your licensed brokerage.
Q. How much do I actually lose if a unit sits vacant for one month?
A. At the national average full-occupancy rent of ¥66,156 (approx. USD 441) per unit, one month of vacancy costs ¥66,156. The average vacancy period per turnover is estimated at about 1.5 months, so one turnover typically costs approximately ¥99,234 (approx. USD 661). For a 10-unit building, the annual vacancy loss works out to ¥118,440 (approx. USD 790; ¥987 × 10 units × 12 months).
Q. Which is the better deal: cutting rent, or offering free rent?
A. Free rent wins decisively, by the numbers. A 5% rent cut (¥3,308 / approx. USD 22) held over the average 6.0-year tenancy costs ¥238,176 (approx. USD 1,588) in lost income, while one month of free rent is a one-time cost of ¥66,156 (approx. USD 441). A rent cut also has the secondary effect of lowering the baseline rent used in your next round of recruiting.
Q. Should I choose an open listing or an exclusive listing?
A. Judge it by inquiry volume over the past three months. If a property is getting plenty of inquiries but not closing, the issue is with the property itself, and an open listing's extra exposure will have limited effect. If inquiries themselves are scarce, an exclusive listing — which lets a single agency concentrate advertising budget and staff time — tends to move faster.
Q. What actually drives a tenant's decision between units?
A. Per the FY2025 Housing Market Trend Survey, households in private rental housing cited: rent was appropriate (45.8%), good location (37.6%), transit convenience (34.2%), close to workplace (27.6%), and design/space/facilities (27.3%), in that order. Among facility-specific reasons, layout/number of rooms (65.8%) and home size (55.3%) ranked highest.
Q. Is there an objective way to check whether a management company is trustworthy?
A. Check its registration under the Rental Housing Management Business Act. Operators managing 200 or more units are legally required to register with the Minister of Land, Infrastructure, Transport and Tourism; as of July 31, 2025, 9,987 operators were registered. MLIT's portal site lets you search registered operators and confirm whether a business manager is appointed at each branch office.
Sources and References
- MLIT (国土交通省), "FY2025 Housing Market Trend Survey" press release (July 17, 2026)
- MLIT (国土交通省), "FY2025 Housing Market Trend Survey Report"
- MLIT (国土交通省), "The Amount of Compensation a Real Estate Broker May Receive in Connection with the Sale, Purchase, or Other Transactions of Land or Buildings" (Ministry of Construction Notification No. 1552 of 1970 / amended by MLIT Notification No. 949, effective July 1, 2024)
- MLIT (国土交通省), "Real Estate Brokerage Act-related materials"
- IREM JAPAN / Japan Association of Rental Housing Management (公益財団法人日本賃貸住宅管理協会), "13th (2025) National Rental Housing Survey"
- Statistics Bureau of Japan (総務省統計局), "2023 Housing and Land Survey: Overview of Basic Tabulation Results Concerning Housing and Households (Preliminary)" (published September 25, 2024)
- Statistics Bureau of Japan (総務省統計局), "2023 Housing and Land Survey: Survey Results"
- MLIT (国土交通省), "Status of Enforcement of the Act on the Proper Management of Rental Housing Business" (as of July 31, 2025)
- MLIT (国土交通省), "Rental Housing Management Business Act Portal Site"
- MLIT (国土交通省), "New Housing Safety Net System" (revised law, effective October 1, 2025)