Commercial building ownership — biru keiei (ビル経営) — is a category of Japanese real estate investment with no exact equivalent in most Western markets: an individual landowner or investor leases an entire building, floor by floor, to businesses rather than to residential tenants, and typically holds it directly rather than through a REIT or fund structure. It sits closer to what a US or UK investor might call direct commercial property ownership, but the tax treatment, lease law, and market data behind it are distinctly Japanese, and none of it is intuitive to someone reading it from outside Japan. As of July 2026, Tokyo's central business districts show an average vacancy rate of 1.95% and average rent of ¥23,287 per tsubo per month (approx. USD 155; JPY figures in this article are converted at the approximate August 2026 rate of ¥150 = US$1, and should be treated as indicative only; 1 tsubo = 3.3 sqm, the traditional Japanese unit of floor area still used throughout the commercial leasing market), and as of April 2026, Class-A buildings in Marunouchi and Otemachi trade at an expected yield of 3.2%. Once you look at the actual numbers, the real risk in commercial building ownership is not "what percentage is vacant" but two much more concrete questions: how much revenue does one empty floor cost you, and how fast are your operating expenses rising. This guide is written for two types of overseas readers: landowners in Japan who already hold the land and are deciding whether to build, and investors considering the outright purchase of a single tenant building. It lays out construction costs, rents, yields, and taxes using primary Japanese government and industry data, so that you can work through the "build it yourself, buy an existing building, or lease out the land alone" decision with real numbers rather than assumptions carried over from your home market.
Key takeaways
- As of July 2026, Tokyo's business districts have an average vacancy rate of 1.95% and average rent of ¥23,287 per tsubo (approx. USD 155) per month — but that headline number hides a wide gap between newly completed buildings (11.37% vacant) and existing buildings (1.78% vacant).
- As of April 2026, expected yields for Class-A offices run 3.2-3.8% in Tokyo and 4.0-5.2% in major regional cities — noticeably tighter than yields typically seen in comparable gateway-city office markets in the US, UK, or Australia.
- Back-calculated from Japanese government construction statistics, reinforced-concrete (RC) construction costs approximately ¥410,000/sqm (¥1.355 million/tsubo, approx. USD 9,000/tsubo), so a 300-tsubo (about 992 sqm) building costs roughly ¥410 million (approx. USD 2.73 million) to build.
- At 200 tsubo of leasable area and Tokyo's average rent, full-occupancy annual rent comes to roughly ¥55.89 million (approx. USD 373,000). If a single 50-tsubo floor sits empty for a year, that alone erases about ¥13.97 million (approx. USD 93,000) — a full quarter of annual income.
- The regulatory framework is fundamentally different from residential rental ownership: commercial rent is subject to Japan's consumption tax, the property tax relief available for residential land does not apply, and the statutory useful life for an RC office building is 50 years. If you have researched Japanese residential (apartment) investment before, do not assume the same rules apply here.
Reading the Market by the Numbers (2026 Snapshot)
Before getting into costs and yields, start with where the market actually stands. The short version: Tokyo's office market is in a phase of falling vacancy and rising rent, while Osaka and Nagoya are running at vacancy rates 1.6 to 1.8 times higher than Tokyo's. This matters for anyone comparing Japan to a single national market the way US or European investors often think about "the office market" — in Japan, the starting assumptions change completely depending on which city, and even which ward, you are looking at.
Vacancy Rates and Rent per Tsubo in Tokyo, Osaka, and Nagoya
Miki Shoji (三鬼商事), the industry-standard source for Japanese office market data — comparable to a CBRE or JLL market report in English-speaking markets — publishes monthly vacancy and rent figures for the three largest metro areas. As of July 2026, the numbers for Japan's three largest metro areas are as follows.
| Business District | Average Vacancy Rate | Average Rent (JPY/tsubo/month) | Change from Previous Month (Vacancy) |
|---|---|---|---|
| Tokyo (5 central wards) | 1.95% | ¥23,287 (approx. USD 155) | down 0.04 pt |
| Osaka | 3.24% | ¥13,411 (approx. USD 89) | up 0.17 pt |
| Nagoya | 3.59% | ¥13,343 (approx. USD 89) | up 0.10 pt |
Tokyo's vacancy rate has now declined for four consecutive months, and average rent is up 11.38% year-on-year (a ¥2,380 increase). Osaka and Nagoya are moving the opposite direction: Osaka's vacancy is rising on the back of newly completed buildings and large-scale downsizing by existing tenants, while Nagoya is seeing secondary vacancy as tenants relocate into new buildings, leaving their old space empty. Tokyo rent now runs about 1.7 times Osaka's or Nagoya's — meaning two buildings with identical floor area can generate income that differs by an entire order of magnitude, depending only on which city they sit in. An investor used to a single national office market — as in much of the US outside a handful of gateway cities — should treat Tokyo, Osaka, and Nagoya as three separate investment cases, not three data points on the same curve.
Ward-Level Data Within Tokyo's Five Central Wards
"Tokyo" is not a single answer either. Even within the five central wards, vacancy and rent vary considerably:
| Ward | Average Vacancy Rate | Average Rent (JPY/tsubo/month) |
|---|---|---|
| Chiyoda | 1.23% | ¥24,914 (approx. USD 166) |
| Chuo | 2.95% | ¥21,351 (approx. USD 142) |
| Minato | 2.18% | ¥23,571 (approx. USD 157) |
| Shinjuku | 2.08% | ¥20,237 (approx. USD 135) |
| Shibuya | 1.11% | ¥26,224 (approx. USD 175) |
Shibuya has both the lowest vacancy rate (1.11%) and the highest rent (¥26,224, approx. USD 175) of the five wards. Chuo sits at the other end, with 2.95% vacancy and rent of ¥21,351 (approx. USD 142). The pattern is clear: the higher the rent in a ward, the lower its vacancy. In practice, this means competition for tenants in central Tokyo is not primarily a price competition — it is a competition on location and building specification. A landlord cannot simply undercut rent to fill space; the building itself, and its address, do most of the work.
What the Gap Between 11.37% (New) and 1.78% (Existing) Really Means
Break down Tokyo's overall 1.95% vacancy rate and a large gap appears: newly completed buildings sit at 11.37% vacant, while existing buildings are down to 1.78%. That six-fold difference tells you exactly where the real risk in commercial building ownership sits.
Existing buildings are essentially full. The double-digit vacancy in new buildings exists because large, newly delivered buildings are still in the process of leasing up, floor by floor. The flip side of that statistic is important for anyone planning to build: a brand-new building is likely to open with meaningful vacancy already baked in, not full occupancy from day one. How you finance the gap between completion and full occupancy — typically several months to a year — is a question that belongs at the very start of your business plan, not an afterthought once construction is underway. Investors coming from markets where pre-leasing is more common before a building tops out should note that speculative, largely unleased delivery is a normal part of the Tokyo development cycle.
How Commercial Building Ownership Differs From Residential Rental Ownership, in Rules and Numbers
It is common to hear vague comparisons — commercial rent is higher, commercial income is more cyclical than residential. What actually determines how much money you keep, though, is the difference in tax treatment and lease law between the two. This is also the real reason many Japanese landowners choose commercial building ownership over residential apartment ownership in the first place, and it is worth understanding in detail if you are comparing the two as an outside investor.
A Seven-Point Comparison of the Two Regulatory Regimes
| Item | Commercial Building (Office/Retail) | Residential Rental |
|---|---|---|
| Expected yield (as of April 2026) | Tokyo (Marunouchi/Otemachi) 3.2% / Ikebukuro 3.8% / Osaka (Umeda) 4.0% / Sendai 5.0% | Tokyo (Jonan area) studio 3.6% / family-type 3.7% |
| Statutory useful life (SRC/RC construction) | Office use: 50 years / Retail & hospital use: 39 years / Restaurant use: 41 years | Residential use: 47 years |
| Straight-line depreciation rate | 50 yrs = 0.020 / 39 yrs = 0.026 / 41 yrs = 0.025 | 47 yrs = 0.022 |
| Consumption tax on rent | Taxable (leasing of offices, retail, etc.) | Exempt (leasing of residential housing) |
| Real estate acquisition tax (building) | Non-residential: 4% | Residential: 3% |
| Fixed asset tax relief for residential land | Not available | Small residential-use land: assessed value reduced to 1/6 (1/3 for city planning tax) |
| Predominant lease type | Fixed-term (teiki) leases are available / lease terms tend to run longer | Standard (futsu) leases with 2-year renewal are typical |
On expected yield alone, Tokyo residential rental (3.6-3.7% in the Jonan area) actually beats Marunouchi/Otemachi office (3.2%). So commercial building ownership is not a "choose it because the yield is higher" investment — if headline yield were the only variable, residential would often win. The real case for it, as covered below, is the freedom to structure leases on your own terms and the breadth of options for how you use the land, both of which matter more over a multi-decade holding period than a percentage point of yield in any single year.
Whether Consumption Tax Applies Changes Your Cash Flow and Paperwork
Residential leasing is exempt from consumption tax in Japan, but leasing office or retail space is a taxable transaction. This is usually the first place someone who has previously owned Japanese residential rental property gets tripped up when they move into commercial ownership. Readers coming from the United States, where there is no federal VAT-style consumption tax on commercial rent, should treat this as a genuinely new mechanic, not a variation on something they already know from sales tax; readers from the UK, EU, Australia, or Singapore will recognize the shape of it immediately, since VAT/GST typically applies to commercial leases in those markets too.
Being subject to consumption tax cuts both ways. You have an obligation to remit the consumption tax you collect from tenants, but you also gain the right to claim an input tax credit on the consumption tax embedded in your construction and repair costs. On a building that costs several hundred million yen to construct, the consumption tax component is not a rounding error — it is a material cash-flow item. Whether to hold the building personally or through a corporation, and whether to elect taxable-business status, are questions to work through with a Japanese tax accountant (zeirishi) before you build, not after. Note also that if a building combines a shop and a residence, only the residential portion is exempt, so rent has to be reasonably apportioned between the residential and commercial floor area.
There Is No Residential Land Tax Relief for Commercial Land — But Tokyo's 23 Wards Offer a Separate Break
Japan's fixed asset tax relief for residential land (small residential-use land is assessed at just 1/6 of standard value) applies only to land under a residential building. Land under a tenant office building counts as non-residential land, so this relief simply does not apply — a meaningful difference from, say, US property tax homestead exemptions, which in some states extend to certain rental configurations. The standard fixed asset tax rate is 1.4%, and city planning tax is capped at 0.3%, which is also the rate applied throughout Tokyo's 23 wards.
There is, however, a separate relief specific to Tokyo's 23 wards: a fixed asset tax and city planning tax reduction for small-scale non-residential land, confirmed again for Reiwa 8 (fiscal 2026). The terms are:
- Reduction amount: 20% off the fixed asset tax and city planning tax owed on the portion of the land up to 200 sqm
- Land requirement: the non-residential land within a single parcel (ikkakuchi) must be 400 sqm or less
- Eligibility: individuals, and corporations with paid-in capital of ¥100 million or less
- Procedure: an application is required (owners who already received the reduction in Reiwa 7 do not need to reapply)
Because of the 400-sqm-or-less parcel requirement, large buildings do not qualify. For owners of small and mid-size buildings, though, this is real money left on the table every year the application is missed — worth flagging to your property manager or tax accountant as a standing annual checklist item, not a one-time filing.
Choosing Among Four Building Styles by Yield and Useful Life
Commercial building ownership in Japan generally falls into four styles: medical-specialty buildings, retail/commercial buildings, office buildings, and mixed-use buildings combining commercial space with residential units above. Which one fits your situation is not a matter of taste — it comes down to three variables: expected yield, statutory useful life, and how hard it is to re-tenant the space once a tenant leaves.
A Decision Table for the Four Styles
| Style | Reference Expected Yield (as of April 2026) | Statutory Useful Life (SRC/RC) | Re-tenanting After Vacancy | Fit-Out & Restoration Burden |
|---|---|---|---|---|
| Medical-specialty building | Not tracked separately in the Real Estate Investor Survey; use office-level yields as a reference | Hospital use: 39 years (depreciation rate 0.026) | Highly specialized fit-out limits the pool of replacement tenants | Tenants typically bear large "B-kōji" (tenant-managed, landlord-supervised) fit-out costs, and the scope of restoration on move-out is a common source of disputes |
| Retail/commercial building | Prime central luxury retail (Ginza) 3.3% / Suburban shopping center (Tokyo) 5.0% | Retail use: 39 years (0.026) / Restaurant use: 41 years (0.025); if wood interior finishing exceeds 30% of value, 34 years applies | Depends entirely on whether the location is replaceable; the difficulty differs sharply between Ginza and suburban sites | Restoration to bare shell ("skeleton") condition is standard; for restaurant tenants, drainage and ventilation restoration costs are hard to predict in advance |
| Office building | Tokyo: Marunouchi/Otemachi 3.2 / Nihonbashi 3.4 / Toranomon 3.5 / Shibuya 3.5 / Konan 3.7 / Nishi-Shinjuku 3.7 / Ikebukuro 3.8; Osaka (Umeda) 4.0 / Nagoya 4.3 / Fukuoka 4.5 / Sendai 5.0 | Office use: 50 years (0.020) | Highly generic space, comparatively easy to re-let | Restoration scope is standardized and relatively easy to estimate |
| Mixed-use building (commercial + residential) | Whole-building residential rental: Tokyo (Jonan) studio 3.6 / family-type 3.7 | Determined by primary use; residential use 47 years (0.022) | Separating use types reduces the chance that both segments go vacant at the same time | The residential portion falls under the Guidelines for Restoration to Original Condition (原状回復ガイドライン, genjō-kaifuku guideline), while the commercial portion is governed purely by contract — creating two separate rule systems within one building |
Medical-Specialty Buildings: Look at Whether a Replacement Tenant Exists, Not the Yield
A building housing multiple independent medical clinics benefits from natural referral traffic between practices and a stable stream of returning patients. Physicians who have opened a practice rarely relocate on a whim, so leases tend to run long. That part of the conventional wisdom holds up.
The problem shows up after a tenant leaves. Clinic interiors and equipment are highly specialized, and unless another practice in the same specialty is available to move in, the space typically cannot be re-let without a major renovation. The statutory useful life for hospital-use buildings is also shorter — 39 years versus 50 for office use, an 11-year difference that affects your depreciation schedule as well. If you are considering a medical-specialty building, the number to research is not the headline expected yield; it is how many more years of demand exists for new clinic openings in that specific area. A high yield on a building with no realistic backup tenant is not a good yield — it is a warning sign.
Retail Buildings: The Gap Between Ginza's 3.3% and Suburban Malls' 5.0% Is a Gap in Substitutability
Expected yield for retail space runs 3.3% for prime central luxury retail in Ginza — flat for three consecutive survey periods — versus 5.0% for a suburban shopping center in Tokyo. Read that 1.7-point gap as a direct measure of how replaceable the location is, not as a measure of building quality.
A retailer that wants to be in Ginza cannot substitute a different location and still be "in Ginza" — that scarcity is exactly why the yield (and therefore the price) is so tight, in the same way flagship retail on Fifth Avenue or Bond Street commands a premium regardless of the building's own merits. Suburban retail has many comparable alternative sites, which gives tenants more negotiating leverage and forces investors to demand a higher yield to compensate. Before considering a retail building, ask the question this framework implies directly: is my location genuinely irreplaceable to a tenant, or is it one of several similar options they could choose instead?
Office Buildings: Longer Leases Mean a Bigger Hit When One Tenant Leaves
Office space is the most generic and most liquid of the four styles, and restoration scope is standardized enough to estimate reasonably well in advance — which is why office buildings are, on balance, the easiest of the four styles to operate. The statutory useful life is also the longest of the group, at 50 years for office use, which keeps annual depreciation expense comparatively small.
The tradeoff is concentration risk within a small number of large leases: because each tenant typically occupies a larger floor area than a retail or medical tenant would, losing a single tenant produces a bigger revenue hit than in the other three styles. The fewer tenants a building has, the more its income falls in large steps rather than smoothly. We work through exactly how large that step is, in real numbers, in the "Translating Commercial Building Risk Into Actual Money" section below.
Mixed-Use Buildings: Vacancy Risk Is Diversified, But the Rules Split Into Two Layers
A building with commercial tenants on the lower floors and residential units above tends to smooth out income, since office/retail demand and housing demand rarely soften at exactly the same time — which is one reason many landowners consider this style first.
The tradeoff is administrative: rent on the residential portion is exempt from consumption tax while the commercial portion is taxable, splitting your bookkeeping into two systems. Lease structuring works the same way in practice — residential units are typically let on standard (futsu) leases, while the commercial space is better suited to a fixed-term (teiki) lease, discussed in detail below. Property management effort increases accordingly compared with a single-use building; budget for that when comparing management fees across building types.
What It Costs to Build, and What You Keep
This is the core of the analysis. Below, we work through construction cost, rental income, NOI, capitalized value, and depreciation in sequence, using real numbers throughout. Every figure comes from Japanese government statistics or published market data — no favorable assumptions, no rounding in your favor.
Construction Cost: About ¥1.355 Million per Tsubo for RC Construction — Roughly ¥410 Million for a 300-Tsubo Building
The Ministry of Land, Infrastructure, Transport and Tourism (国土交通省, MLIT) publishes an annual Building Construction Starts Statistics Survey (建築着工統計調査報告). The summary table for calendar-year Reiwa 7 (2025) reports floor area started and planned construction cost by structural type, from which a per-sqm unit cost can be calculated:
| Structure | Floor Area Started (Reiwa 7 / 2025) | Planned Construction Cost | Cost per sqm | Cost per Tsubo |
|---|---|---|---|---|
| Steel-reinforced concrete (SRC) | 1,075,557 sqm | ¥516.0 billion (approx. USD 3.44 billion) | approx. ¥480,000 (approx. USD 3,200) | approx. ¥1.586 million (approx. USD 10,600) |
| Reinforced concrete (RC) | 18,436,686 sqm | ¥7.55 trillion (approx. USD 50.4 billion) | approx. ¥410,000 (approx. USD 2,700) | approx. ¥1.355 million (approx. USD 9,000) |
| Steel-frame (S) | 33,833,513 sqm | ¥12.56 trillion (approx. USD 83.8 billion) | approx. ¥371,000 (approx. USD 2,500) | approx. ¥1.228 million (approx. USD 8,200) |
| Non-residential buildings, total | 36,475,920 sqm | ¥14.19 trillion (approx. USD 94.6 billion) | approx. ¥389,000 (approx. USD 2,600) | approx. ¥1.286 million (approx. USD 8,600) |
Note: these are averages across all uses. Actual cost varies significantly by use, building grade, number of floors, and ground/soil conditions, so treat this as a sanity-check figure for early-stage planning rather than a substitute for an actual quote. For a more detailed breakdown by structural type, see our companion guide, Construction Cost per Tsubo and How It Breaks Down.
At this unit cost, an RC building with 300 tsubo (about 992 sqm) of total floor area costs roughly ¥410 million to build (approx. USD 2.73 million; ¥1.355 million/tsubo × 300 tsubo = ¥406.5 million).
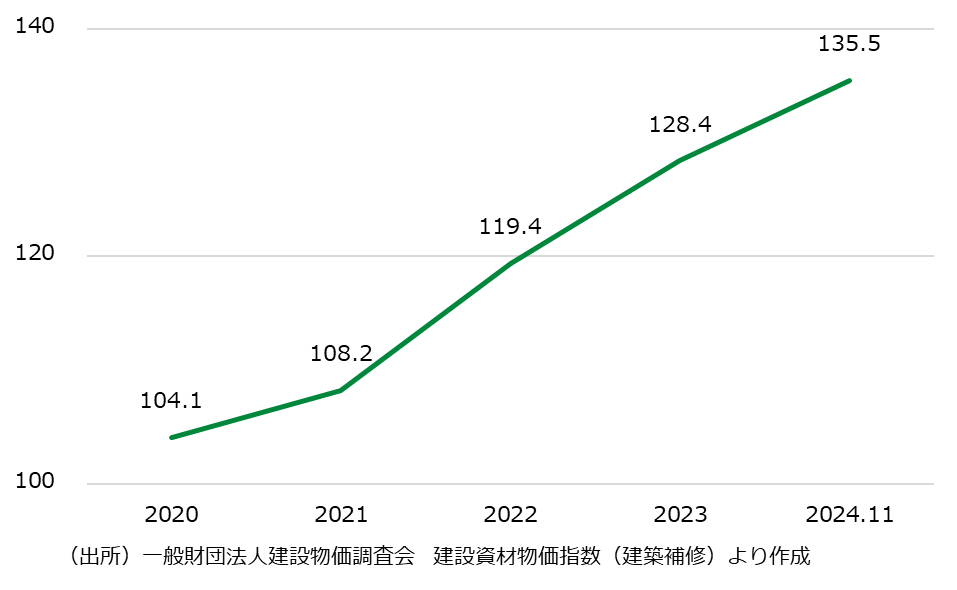
For calendar-year Reiwa 7 (2025), total floor area started across all building types fell 6.7% year-on-year to 95.85 million sqm, and non-residential floor area fell 7.0% to 36.48 million sqm. The fact that planned construction cost rose even as the amount of floor area being built fell is a direct reflection of rising material and labor unit costs — the same cost inflation shown in the chart below.
From Full-Occupancy Rent to NOI
Take a building with 300 tsubo of total floor area and 200 tsubo of leasable area (a rentable ratio of roughly 67%, meaning about a third of the floor plate goes to common areas, cores, and mechanical space), leased at Tokyo's average rent of ¥23,287/tsubo:
| Item | Annual Amount | Basis of Calculation |
|---|---|---|
| Full-occupancy potential rent | approx. ¥55.89 million (approx. USD 373,000) | 200 tsubo × ¥23,287 × 12 months |
| Vacancy loss (assuming 95% occupancy) | approx. -¥2.79 million (approx. -USD 18,600) | Full-occupancy rent × 5% |
| Effective gross income | approx. ¥53.10 million (approx. USD 354,000) | Full-occupancy rent − vacancy loss |
| Operating expenses (management, utilities, repairs, insurance, public dues) | approx. -¥13.28 million (approx. -USD 88,500) | Effective gross income × 25% (assumed) |
| NOI (net operating income) | approx. ¥39.82 million (approx. USD 265,000) | Effective gross income − operating expenses |
Here is a trap that landowners fall into more than outright buyers: the yield looks artificially high if you only count the construction cost. Using just the ¥410 million construction cost as the denominator, gross yield comes to 13.6%. But if the land itself is worth ¥300 million (approx. USD 2.0 million) at market value, total invested capital is really ¥710 million (approx. USD 4.73 million), and gross yield drops to 7.9% — falling further to 5.6% on an NOI basis. Leaving the opportunity cost of the land out of the calculation, simply because you already own it and did not have to write a check for it, will make the project look far more attractive than it actually is. For more on how gross and net yield are defined and used, see How to Calculate Gross and Net Investment Yield.
Working Backward From Expected Yield to Capitalized Value
Dividing NOI by an expected yield gives you an estimate of capitalized value (収益価格, shūeki kakaku) — Japan's version of direct capitalization, conceptually the same technique used to derive value from a cap rate in the US or UK. The same NOI of roughly ¥39.82 million produces very different answers depending on which yield you apply:
| Yield Applied | Capitalized Value | Positioning |
|---|---|---|
| 3.5% | approx. ¥1.14 billion (approx. USD 7.6 million) | Roughly equivalent to a Toranomon Class-A building — the level of a large, prime-grade asset |
| 4.5% | approx. ¥880 million (approx. USD 5.87 million) | Roughly equivalent to Class-A stock in a major regional city |
| 5.5% | approx. ¥720 million (approx. USD 4.8 million) | A building with some disadvantage in age, scale, or location |
The expected yields published in the Real Estate Investor Survey (不動産投資家調査) are benchmarked against Class-A buildings — large, high-specification assets — in each area. Apply those yields directly to a small or mid-size building in the 300-tsubo range and you will significantly overvalue it; smaller buildings trade at higher yields (lower prices) than the survey benchmark suggests. Treat the three scenarios above not as a valuation, but as a sensitivity check: a single percentage point of yield moves the value by more than ¥200 million (approx. USD 1.3 million) in this example, which should tell you how much scrutiny the yield assumption deserves before you rely on it.
This is also a good place to flag something that surprises most first-time overseas investors in Japan more than any tax rule in this article: unlike the MLS-based systems many US, UK, Australian, and Singaporean investors are used to, Japan has no public, transaction-level database of actual sale prices. The Real Estate Investor Survey figures used throughout this article are themselves the industry's workaround — a twice-yearly survey of active investors' and appraisers' return expectations, not a record of what buildings actually sold for. The closest thing to comparable-sales data is MLIT's Real Estate Transaction Price Information (国土交通省 不動産取引価格情報), a government survey of self-reported transactions, but it is anonymized, delayed, and far less granular than an MLS sold-comps search. In practice, this means valuation in Japan leans more heavily on income-based analysis — the NOI-and-yield method walked through in this section — than on pulling recent comparable sales, and it is one more reason to work with a local advisor who tracks actual off-market transaction data rather than relying on public listings alone.
Depreciation: About ¥8.2 Million a Year for RC Office-Use Construction
For a building acquisition cost of ¥410 million, RC construction, office use (statutory useful life 50 years, straight-line rate 0.020), annual depreciation works out as follows:
- Office use (50 years, 0.020): ¥410 million × 0.020 = approx. ¥8.2 million/year (approx. USD 54,700)
- Retail/hospital use (39 years, 0.026): ¥410 million × 0.026 = approx. ¥10.66 million/year (approx. USD 71,000)
- Restaurant use (41 years, 0.025): ¥410 million × 0.025 = approx. ¥10.25 million/year (approx. USD 68,300)
- Residential use (47 years, 0.022): ¥410 million × 0.022 = approx. ¥9.02 million/year (approx. USD 60,100)
The gap between office use and retail use alone is about ¥2.46 million (approx. USD 16,400) a year — a reminder that the declared use of a building changes your annual deductible expense even if the physical structure is identical. Note also that for any building acquired on or after April 1, 1998, the straight-line method is the only depreciation method permitted under Japanese tax law (declining-balance depreciation for buildings was phased out before that date). If you want to understand the depreciation mechanics themselves in more depth, see How Building Depreciation Is Calculated.
Translating Commercial Building Risk Into Actual Money
With the numbers built up so far, "high risk" stops being an abstract phrase and becomes a specific number. In our view, risk management in commercial building ownership essentially means knowing these numbers in advance, before you need them.
Vacancy Risk: One Empty 50-Tsubo Floor for a Year Costs About ¥13.97 Million
Take the same 200-tsubo building, divided into four floors of 50 tsubo each. If one floor sits empty for a full year, the lost revenue is 50 tsubo × ¥23,287 × 12 months = approximately ¥13.97 million (approx. USD 93,000) — exactly a quarter of the ¥55.89 million full-occupancy rent.
This is the single biggest structural difference between commercial building ownership and residential apartment ownership. Lose one unit out of a 20-unit apartment building and income falls by 5%. Lose one tenant out of a four-tenant office building and income falls by 25%. The fewer tenants a building has, the more its income moves in large, discrete steps rather than smoothly. A market-wide vacancy rate of 1.95% is close to meaningless at the level of a single small building — your own building's vacancy rate, in practice, is either 0% or 25%, with nothing in between. An investor coming from a market with dozens or hundreds of residential units under one roof should recalibrate: concentration risk, not market vacancy, is the number that matters here.
This is exactly why it is worth confirming, at the floor-planning stage, what percentage of income disappears if any single unit goes vacant. For the practical side of finding tenants to fill that gap, see Practical Tenant Recruitment for Full Occupancy.
Rising Cost Risk: Management Fees Up 1.2x, Fire Insurance Up 1.5x
Focusing only on income misses what is happening on the expense side. The Xymax Real Estate Institute (ザイマックス不動産総合研究所), in a report published in February 2025, tracked how several cost categories changed between 2020 and 2024:
| Expense Category | Change vs. 2020 (as of 2024) | Underlying Index |
|---|---|---|
| Property management fees (labor cost) | approx. 1.2x | MLIT "Building Maintenance Labor Cost" |
| Repair costs / capital expenditure (materials) | approx. 1.3x (electrical/telecom metal cabling approx. 1.5x) | Construction Research Institute "Building Materials Price Index" |
| Commercial electricity | 1.3x to 1.5x | Bank of Japan "Corporate Goods Price Index" |
| City gas | 1.3x to 1.5x | Bank of Japan "Corporate Goods Price Index" |
| Fire insurance premiums | approx. 1.5x | Bank of Japan "Corporate Service Price Index" |
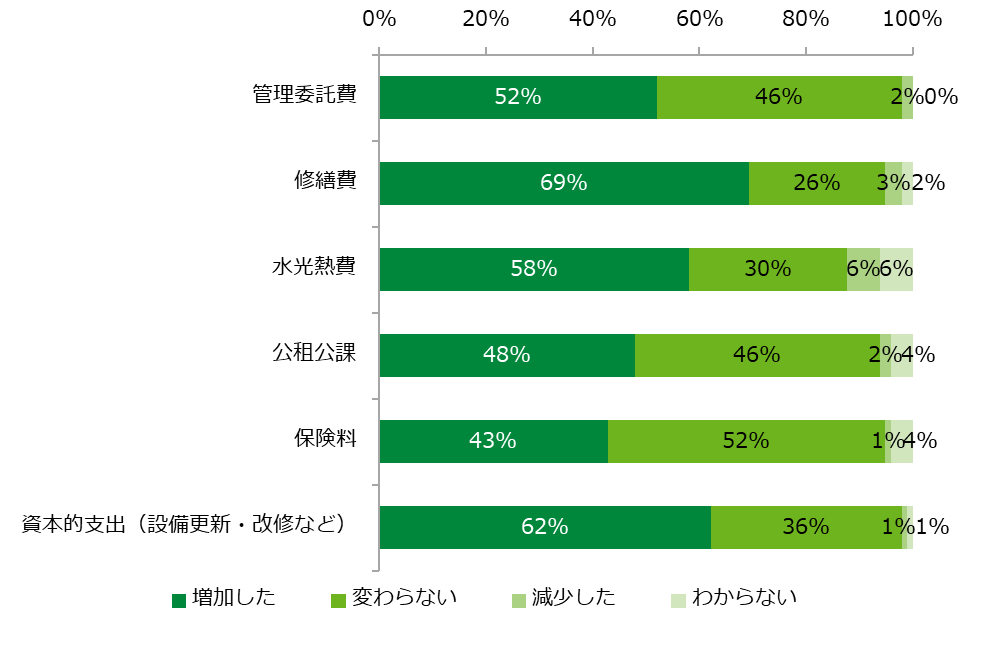
In the same 2024 owner survey, only 37% of respondents felt their income had increased over the past year, versus 66% who felt their expenses had increased. Expenses are currently rising faster than income across Japanese commercial building ownership — a cost-pressure environment that will feel familiar to any investor who has watched insurance and labor costs climb in their home market over the same period, though the magnitude here (fire insurance up roughly 50% in four years) is on the sharper end of what most Western landlords have experienced. In the NOI worked example above, we assumed operating expenses at 25% of effective gross income; treat that ratio as likely to drift upward, not stay fixed, when you build your own projections.
Competitive Risk: The Specification Race Is Happening on the Supply Side
An 11.37% vacancy rate in new buildings does not mean new buildings are struggling to attract tenants in some general sense. With existing buildings already at 1.78% vacancy, it means there is still room for tenants to trade up into newly built, higher-specification space — and that they are doing so.
Seismic performance, individually zoned air conditioning, electrical capacity, common-area design, backup generators: these are the categories where an existing building has the hardest time catching up after the fact. Continued investment in differentiation is necessary, but trying to compete with new construction on every single specification point is not realistic for an existing building, and doing so usually wastes capital that would have been better spent elsewhere. Pick the one or two things that genuinely make your building the tenant's obvious choice, and concentrate your capital there instead of spreading it thin across every category a brand-new building happens to win on.
Exit Risk: A 0.1-Point Yield Shift Moves Value by ¥31.6 Million
Take the same building with NOI of roughly ¥39.82 million, and assume the yield the market applies at the time of sale moves from 3.5% to 3.6% — just a tenth of a percentage point. Capitalized value falls from roughly ¥1.138 billion to roughly ¥1.106 billion, a drop of approximately ¥31.6 million (approx. USD 211,000). Move a full percentage point, and the swing exceeds ¥200 million (approx. USD 1.3 million).
Nothing about the building itself changed — not the rent, not the vacancy rate — yet the price moved substantially. That is the real face of exit risk: it is driven by interest rate environment and investor sentiment as much as by the property's own performance, a dynamic that will feel familiar to anyone who has watched cap rates move in the US or UK office market over an interest rate cycle. The 54th Real Estate Investor Survey (第54回不動産投資家調査) still shows 93% of respondents saying they intend to invest actively going forward — a high reading — but if that sentiment shifts, expected yields will rise and prices will fall. In practical terms, the mitigation is simple: do not commit to a single fixed date for your exit. Building in flexibility around when you sell is one of the few genuinely free ways to manage this risk.
Protecting Yourself Through Lease Structure: Fixed-Term Leases and Business Fixed-Term Land Leases
The single most powerful risk-management tool in commercial building ownership is the lease contract itself. Japan's Act on Land and Building Leases (借地借家法, Shakuchi Shakuya Hō) — the law governing essentially all landlord-tenant relationships in Japan — gives an owner very different future options depending on which contract type is chosen at the outset. This is an area residential landlords in Japan rarely have to think hard about, since standard residential leases are almost always the default (futsu) type; commercial owners do not have that luxury, because the choice materially changes what you can do with the building a decade or two from now.
Comparing the Three Contract Types
| Contract Type | Governing Provision | Term & Requirements | What It Means for the Owner |
|---|---|---|---|
| Standard lease (futsu shakuya) | Act on Land and Building Leases, Art. 28 | Refusing renewal or terminating requires "justifiable grounds" (seitō no jiyū) | A high bar to clear if you want the tenant to vacate for redevelopment or your own use — Japanese law strongly favors the sitting tenant here, more so than most US "at-will" or fixed-term commercial lease norms |
| Fixed-term building lease (teiki shakuya) | Same Act, Art. 38 | Para. 1: requires a written contract (e.g. by notarized document). Para. 3: the landlord must deliver a separate written explanation, in advance, stating that the lease will end at term expiry without renewal. Para. 5: if this advance explanation is not given, the no-renewal provision itself is void. Para. 6: for terms of one year or more, the landlord must send a termination notice between 12 and 6 months before expiry. | Reliably ends at term expiry. Lets the owner design the timing of redevelopment or reconstruction on their own schedule, rather than being at the tenant's mercy |
| Business fixed-term land lease (jigyō-yō teiki shakuchiken) | Same Act, Art. 23 | Para. 1: term of 30 years or more but less than 50 years. Para. 2: term of 10 years or more but less than 30 years. Para. 3: both variants must be executed by notarized document. Purpose must be exclusively for owning a business-use building (residential use is excluded). | Lease out the land alone, without building anything. No construction cost burden, and the land reverts to you as vacant land at term expiry — the closest Japanese equivalent to a Western ground lease, though the fixed maximum term and mandatory notarization have no direct parallel in most US or UK ground-lease practice |
The combination of Article 38, paragraphs 3 and 5, is where fixed-term leases most often go wrong in practice. Simply failing to deliver the advance written explanation is enough, on its own, to void the entire "no renewal" provision — the single most important clause in the contract. A lease can say "fixed-term" (teiki) on its face and still be treated by a court as an ordinary standard lease if the procedural steps were not followed exactly. This is not a detail to delegate entirely to a leasing agent; it is worth the owner personally confirming, ideally with a lawyer, that every procedural requirement was actually met at signing — because the consequence of getting it wrong only becomes visible years later, at exactly the moment you are counting on the lease to end.
Build It Yourself, or Lease Out the Land Alone?
The choice between committing ¥410 million in construction cost to build your own building, versus leasing the land alone under a business fixed-term land lease, comes down to four variables:
- Capital and borrowing capacity: Building requires several hundred million yen in financing as a baseline assumption. Leasing land alone requires no construction spend at all.
- Scale of return: Build it yourself and the rental income flows to you directly — but so does every yen of vacancy risk and repair cost. Lease the land alone and ground rent (地代, chidai) runs lower than building rent would, in exchange for much less volatility.
- How well it works for inheritance planning: As covered in the next section, the valuation discounts for a leased building (貸家, kashiya) and the land under it (貸家建付地, kashiya-tsuke-chi) apply when you own and lease the building yourself. Lease out the land alone instead, and it is valued as leased land (貸宅地, kashi-takuchi) under a different calculation entirely.
- Years to exit: A business fixed-term land lease runs either 30-to-under-50 years or 10-to-under-30 years. Whether you can commit now to what the next generation will do with that land at the end of the term is the real dividing line between these two paths.
The Tax and Cash-Flow Picture: Acquisition, Holding, and Inheritance
At Acquisition: Real Estate Acquisition Tax Is 4% on a Non-Residential Building
The real estate acquisition tax (不動産取得税, fudōsan shutokuzei) — a one-time tax due when you acquire real property, roughly analogous to a transfer tax or stamp duty in other jurisdictions, though calculated differently — carries the following rates and relief, using Tokyo as the example:
| Item | Detail | Applicable Period |
|---|---|---|
| Rate: land / building (residential) | 3% | April 1, 2008 – March 31, 2027 |
| Rate: building (non-residential) | 4% | Same period |
| Assessed value for residential land / land-equivalent lots | Value × 1/2 | Through March 31, 2027 |
| Tax-exempt threshold (for acquisitions from April 1, 2026) | Land: ¥160,000 (approx. USD 1,070) / Building (new construction, addition, remodel): ¥660,000 (approx. USD 4,400) / Building (other, e.g. purchase): ¥340,000 (approx. USD 2,270) | — |
For acquisitions completed on or before March 31, 2026, the exempt thresholds were lower — ¥100,000 (approx. USD 670) for land, ¥230,000 (approx. USD 1,530) for new-construction buildings, and ¥120,000 (approx. USD 800) for other building acquisitions — meaning the thresholds effective from April 1, 2026 represent a significant increase. For the full acquisition-tax calculation procedure, see Real Estate Acquisition Tax: Calculation and Relief Measures.
While Holding: Fixed Asset Tax, City Planning Tax, and the 23-Ward Relief
While you hold the building, fixed asset tax (standard rate 1.4%) and city planning tax (0.3%) both apply annually. As covered above, the residential land relief is not available, but within Tokyo's 23 wards, if the non-residential land within a single parcel is 400 sqm or less, the tax owed on the portion up to 200 sqm is reduced by 20%. This relief requires an application — worth confirming with your accountant or property manager whether your building qualifies, since it is easy to simply forget to file for it.
At Inheritance: How Far Do Leased-Building and Leased-Building-Land Valuations Actually Fall?
This is historically the single biggest reason Japanese landowning families choose commercial building ownership: the compression it produces in inheritance tax valuation. There is no direct US or UK equivalent to this mechanic — it is a distinctly Japanese feature of how leased real estate is valued for inheritance tax purposes, and it deserves to be understood on its own terms rather than mapped onto a familiar concept from your home market. The formulas are:
- Leased building (kashiya, 貸家) = Fixed asset tax assessed value − (Fixed asset tax assessed value × leasehold-interest ratio × occupancy ratio)
- Leased-building land (kashiya-tsuke-chi, 貸家建付地) = Value as owner-occupied land − (Value as owner-occupied land × land-lease-right ratio × leasehold-interest ratio × occupancy ratio)
The leasehold-interest ratio (借家権割合, shakuyaken wariai) is set by the regional taxation bureau director and published in the Rosenka (路線価, roadside land price) system's Property Valuation Standards. For Reiwa 8 (2026), Tokyo's ratio remains 30%, as it has for years. The land-lease-right ratio (借地権割合, shakuchiken wariai) is shown as a letter grade on the roadside price map: A = 90%, B = 80%, C = 70%, D = 60%, E = 50%, F = 40%, G = 30%.
Work through an example: 300 sqm of land (owner-occupied valuation ¥300 million, land-lease-right ratio 70%), with a building on it valued at ¥200 million for fixed asset tax purposes, fully leased:
| Item | Value Before Relief | Calculation | Value After Relief |
|---|---|---|---|
| Building (leased/kashiya) | ¥200 million (approx. USD 1.33 million) | ¥200 million × (1 − 30% × 100%) | ¥140 million (approx. USD 933,000) |
| Land (kashiya-tsuke-chi) | ¥300 million (approx. USD 2.0 million) | ¥300 million × (1 − 70% × 30% × 100%) | ¥237 million (approx. USD 1.58 million) |
| Land (with Small-Scale Business/Rental Land Relief applied) | ¥237 million (approx. USD 1.58 million) | 50% deduction on the portion equivalent to 200 sqm, ¥158 million → deduct ¥79 million | ¥158 million (approx. USD 1.05 million) |
| Total | ¥500 million (approx. USD 3.33 million) | — | ¥298 million (approx. USD 1.99 million) |
That is a reduction of roughly ¥202 million (approx. USD 1.35 million) — about 40% of the pre-relief total. The Small-Scale Business/Rental Land Relief (小規模宅地等の特例, shōkibo takuchi-tō no tokurei), applied here as the "land used for a rental business" category (貸付事業用宅地等), reduces value by 50% on the first 200 sqm, but it comes with conditions worth understanding precisely. Real estate leasing, parking-lot operation, and comparable quasi-businesses all qualify, but only if the owner has been receiving reasonable, continuing consideration for the use of the land — land lent for free or below-market (使用貸借, shiyō taishaku) does not qualify. Land that was newly put into rental-business use within three years before the inheritance began is, as a general rule, also excluded. In plain terms: building or leasing a property right before death specifically to capture this relief does not work, and the tax authorities have designed the rule specifically to close that loophole.
These figures are illustrative, meant to show how the mechanism works. In an actual inheritance tax filing, the roadside land price, various correction factors, the occupancy ratio, and interactions with other relief provisions will all change the final number. Consult a Japanese tax accountant for your specific situation — this is genuinely not a do-it-yourself calculation once real money and a real family are involved.
What We Check First When Clients Come to Us About Commercial Building Ownership
When a client comes to us about commercial building ownership, the first question we ask is not about yield. It is: who is going to operate this building, and for how many years?
Everything calculated above is arithmetic — once you have the assumptions, anyone can run the numbers. But when a floor sits empty ten years after completion, it is not a formula that fills it. It is people: noticing a tenant's business is changing, catching the early signs that they are planning to leave, and already having the next candidate lined up before the space actually goes vacant. Whether a team can do this consistently — not once, but for every vacancy over decades — is what actually separates two buildings with identical location and identical specification into different occupancy rates.
We believe people are a company's most important asset (人財, jinzai — we deliberately use the character for "asset" rather than the more common character for "human resources," to signal that we mean it literally). In the context of commercial building ownership, that principle translates into a specific practice: do not treat your property management company purely as a cost to be negotiated down; build the relationship as a partnership where information flows to you. The people who are in a building every day — walking the floors, talking to facility managers — are also the people who hear first about a tenant's expansion plans or a quiet relocation search. Management fees have risen roughly 1.2x since 2020, as covered above; the question we ask is whether that increase has been matched by a management relationship that is actually surfacing information from the ground, not merely collecting a fee.
The other thing we confirm is whether the owner has locked themselves into a single exit path without realizing it. Sale, rebuild, succession to the next generation, conversion to a business fixed-term land lease — whichever path you eventually choose, if the lease structure is fixed on standard (futsu) leases throughout the building, several of those options effectively disappear, because you cannot easily reclaim vacant possession to execute them. This is exactly why we recommend building fixed-term (teiki) leases into the design from the very beginning, even if it means accepting slightly more negotiating friction with tenants at signing. Maximizing short-term rent is rarely the objective that protects the asset best. Keeping real options open ten years out is.
Summary
- As of July 2026, Tokyo's business districts average 1.95% vacancy and ¥23,287/tsubo (approx. USD 155) rent. Osaka runs 3.24% vacancy and ¥13,411 (approx. USD 89); Nagoya runs 3.59% and ¥13,343 (approx. USD 89). Starting assumptions differ sharply by city.
- New-building vacancy sits at 11.37% versus 1.78% for existing buildings. Anyone planning new construction needs a financing plan that assumes vacancy immediately after completion, not full occupancy from day one.
- RC construction costs roughly ¥1.355 million/tsubo (approx. USD 9,000); a 300-tsubo building runs approximately ¥410 million (approx. USD 2.73 million) to build. At 200 tsubo of leasable area and Tokyo's average rent, full-occupancy annual rent is roughly ¥55.89 million (approx. USD 373,000), with NOI around ¥39.82 million (approx. USD 265,000).
- A single 50-tsubo floor sitting empty for a year costs roughly ¥13.97 million (approx. USD 93,000) — a quarter of full-occupancy rent. Manage vacancy risk in yen (or dollars), not in percentage points.
- Consumption tax on rent, the absence of residential land tax relief, statutory useful life (50 years office / 39 years retail / 47 years residential), and lease structure: the regulatory framework for commercial building ownership is fundamentally different from residential rental ownership, not merely a variation on it.
- Inheritance tax valuation falls substantially under the leased-building and leased-building-land discounts, plus the Small-Scale Business/Rental Land Relief — but only when the land has been receiving reasonable, continuing rental consideration on an ongoing basis.
Frequently Asked Questions (FAQ)
- Q. What is a reasonable benchmark yield for commercial building ownership in Japan?
- A. As of April 2026, expected yields for Class-A offices are 3.2% in Marunouchi/Otemachi, 3.4% in Nihonbashi, 3.5% in Toranomon, and 3.8% in Ikebukuro within Tokyo, and 4.0% in Osaka (Umeda), 4.3% in Nagoya/Yokohama, 4.5% in Fukuoka, and 5.0% in Sendai among major regional cities. These figures reflect large, prime-grade buildings; small and mid-size buildings typically trade at higher yields (i.e., lower prices) than this benchmark.
- Q. What vacancy rate should I consider normal for a tenant building?
- A. As of July 2026, Tokyo's business districts average 1.95% vacancy, or 1.78% if you look only at existing buildings. In a market where the average is already below 2%, comparing your own building's vacancy rate to that market average is not very useful. In a building with few tenants, a single vacant unit can drop occupancy by 20% or more, so we recommend managing vacancy as "annual revenue lost per unit" in yen (or dollars) rather than as a percentage.
- Q. What does it cost per tsubo to construct an office building in Japan?
- A. Calculated from the Building Construction Starts Statistics Survey (calendar-year Reiwa 7/2025), RC construction runs approximately ¥410,000/sqm (approx. ¥1.355 million/tsubo, approx. USD 9,000), SRC construction approximately ¥480,000/sqm (approx. ¥1.586 million/tsubo, approx. USD 10,600), and steel-frame construction approximately ¥371,000/sqm (approx. ¥1.228 million/tsubo, approx. USD 8,200). These are averages across all uses and vary significantly by use, building grade, number of floors, and ground conditions.
- Q. Does consumption tax apply to rent on a tenant building?
- A. Yes. Leasing residential housing is exempt from consumption tax, but leasing office, retail, or other business-use space is a taxable transaction. If a building combines a shop and a residence, only the residential portion is exempt, so rent must be reasonably apportioned between the residential and commercial floor area.
- Q. How much does commercial building ownership reduce inheritance tax valuation?
- A. A leased building is valued at [fixed asset tax assessed value × (1 − 30% leasehold-interest ratio × occupancy ratio)], and leased-building land at [owner-occupied valuation × (1 − land-lease-right ratio × 30% leasehold-interest ratio × occupancy ratio)]. In a worked example with ¥300 million of land (70% land-lease-right ratio) and a ¥200 million building at fixed asset tax valuation, applying the Small-Scale Business/Rental Land Relief (50% off up to 200 sqm) as well brings the combined total to approximately ¥298 million — a reduction of roughly 40%. This requires that the property has been receiving reasonable, continuing rental consideration on an ongoing basis.
- Q. Can an individual realistically start commercial building ownership, or does it require a corporation?
- A. A 300-tsubo RC building costs roughly ¥410 million (approx. USD 2.73 million) in construction cost alone, so this is a realistic option primarily for someone who already owns the land and has both borrowing capacity and a long-term cash-flow plan in place. There is also a path that avoids the construction cost entirely: leasing out the land alone under a business fixed-term land lease, letting the tenant build at their own expense.
- Q. If I sign a fixed-term (teiki) lease, is the tenant guaranteed to vacate at the end of the term?
- A. Yes, provided every procedural requirement was followed. If the landlord did not deliver the advance written explanation required under Article 38, paragraph 3 of the Act on Land and Building Leases, the no-renewal provision itself becomes void under paragraph 5 — meaning the lease could be treated as an ordinary standard lease instead. For terms of one year or more, the landlord must also send a termination notice between 12 and 6 months before expiry.
Citations & Sources
- Miki Shoji (三鬼商事), "Tokyo Business District Office Market" (as of July 2026)
- Miki Shoji (三鬼商事), "Osaka Business District Office Market" (as of July 2026)
- Miki Shoji (三鬼商事), "Nagoya Business District Office Market" (as of July 2026)
- Japan Real Estate Institute (日本不動産研究所), "54th Real Estate Investor Survey" (as of April 2026; published May 27, 2026)
- Ministry of Land, Infrastructure, Transport and Tourism (国土交通省, MLIT), "Building Construction Starts Statistics Survey Report (Calendar Year Reiwa 7)" (January 30, 2026)
- MLIT, "Building Construction Starts Statistics Survey Report (Calendar Year Reiwa 7), Press Release Materials (Excel, Summary Table)"
- National Tax Agency (国税庁, NTA), Tax Answer No. 2100, "Overview of Depreciation" / Table of Useful Life for Major Depreciable Assets
- NTA, Tax Answer No. 2106, "Depreciation Under the Straight-Line and Declining-Balance Methods" / Table of Depreciation Rates for Depreciable Assets
- NTA, Tax Answer No. 6226, "Leasing of Residential Housing"
- NTA, Tax Answer No. 4602, "Valuation of Land and Buildings"
- NTA, Tax Answer No. 4614, "Valuation of Leased-Building Land (Kashiya-tsuke-chi)"
- NTA, Basic Notice on Property Valuation, Chapter 3, "Buildings and Rights Existing on Buildings" (Articles 89, 93, 94)
- NTA, Tax Answer No. 4124, "Small-Scale Business/Rental Land Relief" / Same, Q&A
- NTA, "Reiwa 8 Property Valuation Standards, Tokyo, Leasehold-Interest Ratio" / Explanation of Roadside Land Price Maps (Land-Lease-Right Ratio Symbols)
- Tokyo Metropolitan Government Bureau of Taxation, "Real Estate Acquisition Tax" (Metropolitan Tax Q&A)
- Tokyo Metropolitan Government Bureau of Taxation, "Fixed Asset Tax / City Planning Tax (Land and Buildings)"
- Tokyo Metropolitan Government Bureau of Taxation, "Fixed Asset Tax / City Planning Tax Relief for Small-Scale Non-Residential Land (Within the 23 Wards)"
- e-Gov Japanese Law Search, "Act on Land and Building Leases" (Act No. 90 of 1991)
- Xymax Real Estate Institute, "The Current State of Rising Expenses in Commercial Building Ownership" (February 3, 2025)