Apartment investing in Japan (アパート経営, apāto keiei) is a distinctively Japanese asset class: small, wood-frame or reinforced-concrete rental buildings, typically 6 to 30 units, bought and held directly by individual investors rather than packaged into a REIT or a syndicated fund, which is the more common route into rental housing in the US, UK, or Australia. Failure in this asset class rarely comes from a bad location. It comes from failing to set four numbers — vacancy rate, interest rate, repair cost, and property management fee — conservatively, using Japan's own public data. Reset just these four assumptions and a property advertised at a 6.0% surface (gross) yield falls to a real yield of about 3.5%. Move the interest rate by just 0.8 percentage points, and the calculation shows the investor's cash flow turning negative.
This article is written for three kinds of readers: those about to buy their first Japanese apartment building, those who already own one and are seeing less cash flow than they expected, and those wondering whether it's time to change property managers. Rather than stringing together anecdotal failure stories, it uses primary-source 2026 data published by Japan's Ministry of Internal Affairs and Communications (総務省, Sōmushō), the Bank of Japan (日本銀行, Nippon Ginkō), the Ministry of Land, Infrastructure, Transport and Tourism (国土交通省, MLIT), and the National Tax Agency (国税庁, Kokuzeichō) to pin down, in both yen and dollars, exactly where and how much money is lost. For the single most common concern readers raise — losses caused by the property manager — this article lays out the actual market distribution of management fees and a free, government-run lookup tool under the Act on Improvement of Management of Rental Housing (賃貸住宅管理業法, Chintai Jūtaku Kanri Gyō Hō), a public registry with no direct equivalent in most Western property-management markets, where a manager's licensing status and disciplinary history are rarely a single free search away.
Key points in this article
- Property management fees, as a share of monthly rent, most commonly fall in the 3–5% band (51.9% of managers), while only 1.9% charge 10% or more (MLIT, FY2025 survey). Owners who negotiate without knowing this market range are the ones who overpay.
- The average contracted interest rate on new, long-term (1-year-plus) loans from Japanese domestic banks rose from 1.111% in June 2024 to 1.944% in June 2026 — a 0.833-point increase in two years (Bank of Japan). On an ¥80 million (approx. USD 506,000) loan amortized over 30 years, that alone adds roughly ¥368,000 (approx. USD 2,329) a year to loan repayments.
- For a 20-unit reinforced-concrete (RC) apartment building, the 30-year repair bill totals about ¥44.9 million per building, or roughly ¥2.25 million per unit (approx. USD 284,000 per building / USD 14,240 per unit) (MLIT). Without a reserve fund, about ¥1.16 million (approx. USD 7,340) per unit comes due in a single lump sum between years 21 and 25.
- Japan has 4.436 million vacant rental units nationwide, and 78.5% of vacant multi-unit residential buildings are rental stock (Ministry of Internal Affairs and Communications, 2023 Housing and Land Survey). A cash-flow plan built on 100% occupancy collides directly with this reality.
- Any property manager overseeing 200 or more units is legally required to register with the Minister of Land, Infrastructure, Transport and Tourism. Anyone — including an overseas owner who has never set foot in Japan — can check that registration status and any past disciplinary action for free, in about five minutes, through MLIT's public online system.
Sizing Up Apartment-Investment Risk With Primary Data, Not Gut Feel
Risk in Japanese apartment investing comes down to four variables: vacancy, interest rates, repairs, and disaster/insurance. Every one of them is published in official government statistics, so there is no need to estimate any of them by feel. Here is where each number currently stands.
Vacancy Risk: 4.436 Million Vacant Rental Units, 78.5% of Vacant Multi-Unit Buildings Are Rental Stock
According to the Statistics Bureau of Japan's "2023 Housing and Land Survey" (令和5年住宅・土地統計調査, published September 25, 2024, final tabulation), the nationwide vacant-housing count stands at 9.002 million units, a vacancy rate of 13.8% — an all-time high. Break that figure down, and numbers that matter directly to a rental-property owner emerge.
| Item | Units | How to read it |
|---|---|---|
| Total vacant housing | 9.002 million units (13.8% vacancy rate) | Up 0.2 points from 13.6% in 2018 — an all-time high |
| Vacant units held for rent | 4.436 million units | 49.3% of all vacant housing. This is real, existing inventory competing for your tenants |
| Vacant multi-unit residential buildings | 5.029 million units (of which 78.5%, or 3.947 million units, are held for rent) | About 8 out of 10 vacant apartment/condo units are sitting empty while still rentable |
| Total rented housing | 19.462 million units (35.0% of all housing) | Of which 15.684 million units (28.2%) are privately owned rentals |
| Monthly rent, rented housing (dedicated residential) | ¥59,656 (approx. USD 378) — up 7.1% from 2018 | Private rentals: wood-frame ¥54,409 (approx. USD 344) / non-wood-frame ¥68,548 (approx. USD 434) |
From these figures, it is possible to estimate a market-wide rental vacancy rate. Divide the 4.436 million vacant-for-rent units by the sum of 19.462 million total rented units and 4.436 million vacant-for-rent units, and the result is roughly 18.6%. This is not an officially published vacancy rate — it is this article's own estimate, built from the government's raw figures. Even so, it makes clear how far a cash-flow plan built on 95% or 100% occupancy sits from the market's actual average. Unlike US multifamily markets, where metro-level vacancy rates are widely reported by commercial data providers and updated quarterly, Japan does not publish a single official national rental-vacancy index — this estimate is the closest practical substitute, and international owners should not mistake its absence for a low-vacancy market.
Interest-Rate Risk: New, Long-Term Lending Rates Rose 0.833 Points in Two Years
According to the Bank of Japan's "Average Contracted Interest Rates on Loans and Discounts" (貸出約定平均金利), the average rate on new, long-term (contract period of one year or more) loans from Japanese domestic banks has moved clearly upward over two years.
| Date | New loans, long-term | Outstanding loans, long-term |
|---|---|---|
| June 2024 | 1.111% | 0.798% |
| June 2025 | 1.359% | 1.069% |
| December 2025 | 1.530% | 1.142% |
| June 2026 | 1.944% | 1.368% |
| Change since June 2024 | +0.833 points | +0.570 points |
Source: Bank of Japan, "Average Contracted Interest Rates on Loans and Discounts (Monthly)" (日本銀行「貸出約定平均金利(月次)」) (statistical definitions per Bank of Japan, "Average Contracted Interest Rates on Loans and Discounts")
The number to watch in this table is the gap between new and outstanding loans. The rate facing anyone taking out financing now — new, long-term — has climbed to 1.944%, while the average for people who already hold a loan — outstanding, long-term — remains at just 1.368%. In other words, the interest rate on existing loans has not yet fully caught up, which means owners on variable-rate mortgages still have room for their repayments to rise at the next rate reset. Unlike the US 30-year fixed-rate mortgage, which locks in a rate for the full loan term, most Japanese apartment-building loans to individual investors are variable-rate or subject to periodic repricing — a structural difference that international borrowers frequently underestimate. When evaluating a refinance or a new acquisition, it is safer to recalculate using the new, long-term rate rather than the rate printed on your existing repayment schedule.
Repair Risk: A 20-Unit RC Building Needs About ¥44.9 Million (Approx. USD 284,000) Over 30 Years
Repair costs are not a vague "someday, a big bill will come due" risk — the timing and the amount are both laid out in official government material. MLIT's guidebook "How Old Is Your Rental Property?" (あなたの賃貸住宅は何歳ですか?) presents the following model for a 20-unit reinforced-concrete (RC) rental building (1LDK–2DK unit types).
| Period | Per unit | Per building (20 units) | Main repair work |
|---|---|---|---|
| Years 5–10 | Approx. ¥90,000 (approx. USD 570) | Approx. ¥1.70 million (approx. USD 10,760) | Repainting balconies, stairs, corridors; fixing in-unit equipment; drain pipe cleaning |
| Years 11–15 | Approx. ¥550,000 (approx. USD 3,480) | Approx. ¥10.90 million (approx. USD 68,990) | Repainting roof and exterior walls; repairing/replacing water heaters, etc. |
| Years 16–20 | Approx. ¥230,000 (approx. USD 1,460) | Approx. ¥4.60 million (approx. USD 29,110) | Repainting balconies, stairs, corridors; cleaning/replacing water supply and drain pipes |
| Years 21–25 | Approx. ¥1.16 million (approx. USD 7,340) | Approx. ¥23.20 million (approx. USD 146,800) | Roof re-covering, exterior repainting, bathroom fixture replacement, water supply/drain pipe replacement |
| Years 26–30 | Approx. ¥230,000 (approx. USD 1,460) | Approx. ¥4.60 million (approx. USD 29,110) | Repainting, in-unit equipment repair, exterior grounds repair |
| 30-year total | Approx. ¥2.25 million (approx. USD 14,240) | Approx. ¥44.90 million (approx. USD 284,000) | — |
Source: MLIT, "How Old Is Your Rental Property?" (国土交通省「あなたの賃貸住宅は何歳ですか?」) (figures are from that document's long-term repair-plan model; actual timing and amounts vary by individual property)
The peak is years 21–25, when roughly ¥23.20 million (approx. USD 146,800) per building comes due at once. The same document assumes a monthly reserve contribution of about ¥7,000 (approx. USD 44) per unit to cover repair costs up through that period. Save ¥7,000 a month per unit for 25 years and you accumulate ¥2.10 million (approx. USD 13,290); the repair cost needed by year 25 is about ¥2.03 million (approx. USD 12,850) per unit — so the assumption checks out as internally consistent.
Disaster Risk: Reference Fire-Insurance Loss Rates Up 13.0% Nationwide, Flood Risk Now Split Into 5 Tiers
Insurance costs are rising too. The General Insurance Rating Organization of Japan (損害保険料率算出機構, Songai Hoken Ryōritsu Sanshutsu Kikō) filed a revision to its reference fire-insurance loss rates (火災保険参考純率) with the Commissioner of the Financial Services Agency on June 21, 2023, raising the reference rate for comprehensive homeowners' insurance by 13.0% nationwide on average, and splitting the flood-risk (水災) rate into 5 regional risk tiers. The driver is rising insurance payouts from natural disasters. As of August 2026, this remains the organization's most recent filing.
Note that the reference loss rate is a base figure insurers use when calculating premiums — it is not itself the rate of change in what a policyholder actually pays. The organization states this explicitly. Depending on where a property's flood-risk tier falls on Japan's hazard maps, premiums may move at each renewal — worth building into a cash-flow plan.
Source: General Insurance Rating Organization of Japan, "Notice of Revision to Reference Fire Insurance Loss Rates" (June 28, 2023) / General Insurance Rating Organization of Japan, "Reference Fire Insurance Loss Rates"
Lining Up All Four Risks by Timing, Dollar Impact, and Available Countermeasures
Each of these four risks bites at a different time and a different scale. Only when you line them up side by side does it become clear where to act first.
| Risk | When it hits | Approximate dollar impact | Countermeasure available in advance | Public data source |
|---|---|---|---|---|
| Vacancy | Every year, from year one | A 15-point drop in occupancy on a ¥6 million (approx. USD 38,000) rent roll costs about ¥900,000 (approx. USD 5,700) a year | Underwrite at 85% occupancy / switch to a manager with strong leasing capability | MIC, Housing and Land Survey |
| Interest rate | At every reset, if variable-rate | A 0.8-point rise on an ¥80 million (approx. USD 506,000), 30-year loan adds about ¥368,000 (approx. USD 2,329) a year | Recalculate at the new, long-term rate / review your fixed-vs-variable mix | Bank of Japan, Average Contracted Interest Rates |
| Repairs | Concentrated in years 11–15 and 21–25 | A 20-unit RC building needs about ¥23.20 million (approx. USD 146,800) per building in years 21–25 | Reserve about ¥7,000 (approx. USD 44) per unit monthly / build a long-term repair plan | MLIT, rental-housing repair materials |
| Disaster / insurance | At each policy renewal and in the event of a loss | Reference loss rate up 13.0% nationwide on average; flood risk now split into 5 regional tiers | Check your flood-risk tier on the hazard map / scrutinize coverage scope | General Insurance Rating Organization of Japan |
7 Apartment-Investment Failure Patterns: Tracking What Happens, in Dollars
From here, this article breaks down seven failure patterns that actually occur in Japan and calculates, for each one, exactly how much money is lost. Every example is built so you can hold your own property's numbers up against it.
① Buying on Surface Yield Alone: How a 6.0% Headline Yield Becomes a 3.5% Real Yield
This is the most common entry-level mistake. A surface (gross) yield is nothing more than annual full-occupancy rent divided by purchase price — it deducts nothing for vacancy, management fees, repair reserves, or taxes. Unlike a US cap rate, which market convention typically calculates net of operating expenses, the "利回り" (yield) figure on a Japanese listing sheet is almost always this unadjusted gross number — a distinction every international buyer needs to internalize before comparing a Japanese listing to a US, UK, or Australian one. Here is the math for an apartment building priced at ¥100 million (approx. USD 633,000), with ¥6 million (approx. USD 38,000) in annual full-occupancy rent across 8 units.
| Item | Amount | Basis for the assumption |
|---|---|---|
| Annual full-occupancy rent | ¥6.00 million (approx. USD 38,000) | 6.0% surface yield |
| Actual income at 85% occupancy | ¥5.10 million (approx. USD 32,300) | A slightly relaxed version of the estimated ~18.6% market-wide rental vacancy rate (15% vacancy used here) |
| − Property management fee (5% of actual income) | ¥255,000 (approx. USD 1,610) | The 5–10% fee band covers 38.8% of managers (MLIT, FY2025) |
| − Repair reserve (¥7,000/unit/month × 8 units) | ¥672,000 (approx. USD 4,250) | MLIT's reserve-fund assumption |
| − Fixed asset tax, city planning tax, fire insurance | ¥700,000 (approx. USD 4,430) (placeholder) | Varies by property — replace with your actual tax notice and policy figures |
| Net Operating Income (NOI) | ¥3.473 million (approx. USD 21,980) | — |
| Real yield | Approx. 3.5% | ¥3.473 million ÷ ¥100 million |
The 6.0% surface yield becomes a 3.5% real yield — a gap of 2.5 percentage points. And this calculation still uses the purchase price as its denominator; add in acquisition costs such as brokerage commission, real estate acquisition tax, and registration fees (Japan's rough equivalent of US closing costs, though structured very differently and typically higher as a share of price) and the real yield falls further still. A surface yield is only an entry-level figure for comparing listings — never a return you can bank on.
② Judging Location by Population Alone, Instead of Households and Vacancy Rates
Judging a location purely by population decline is a common way to misjudge it, because rental demand is measured in households, not individuals. According to the National Institute of Population and Social Security Research's "Household Projections for Japan (National Estimates): 2024 Projections" (日本の世帯数の将来推計〈全国推計〉令和6〈2024〉年推計), the total number of general households will keep rising from 55.70 million in 2020 to a peak of 57.73 million in 2030, before turning down to a projected 52.61 million by 2050. Single-person households are projected to peak at 24.53 million in 2036, and average household size is projected to fall below 2 people for the first time in 2033, at 1.99.
In short: even as Japan's population shrinks, the number of households is still growing, and single-person households have roughly another decade of growth ahead. Demand for studio and 1LDK units will not disappear overnight. But regional differences show up clearly in vacancy rates.
| Category | Prefectures and vacancy rates |
|---|---|
| Low (demand relatively deep versus supply) | Saitama 9.3% / Okinawa 9.4% / Kanagawa 9.8% / Tokyo 10.9% / Aichi 11.8% |
| National average | 13.8% |
| High (existing inventory oversupplied) | Tokushima 21.3% / Wakayama 21.2% / Kagoshima 20.5% / Yamanashi 20.4% / Kochi 20.3% / Nagano 20.1% |
Source: Statistics Bureau of Japan, "2023 Housing and Land Survey" — vacancy rate by prefecture / National Institute of Population and Social Security Research, "Household Projections for Japan (National Estimates): 2024 Projections" (国立社会保障・人口問題研究所)
It is no coincidence that prefectures with vacancy rates above 20% are also where 12% surface-yield listings show up. A high headline yield is the market's way of pricing in vacancy risk. Cross-reference a prefecture's vacancy rate against the household trend at the municipal level before you buy. Unlike the US, where county- and even ZIP-code-level rental vacancy and household data is often just a few clicks away through the Census Bureau, this kind of granular, English-language comparison rarely exists for Japan — investors typically need to combine several Japanese-language government sources themselves, or work with a local partner who already does. We cover this in a separate article: how to identify locations that hold value even as Japan's population declines.
③ Full Leverage Lets the Debt-Service Ratio Spike: an 0.8-Point Rate Move Pushes DSCR Below 1.0
Taking on a large loan with little or no equity means that any rise in interest rates flows straight through to what you actually keep. Using the same ¥100 million property, with an ¥80 million (approx. USD 506,000) loan on a 30-year, equal-principal-and-interest amortization schedule, here is the math.
| Item | Rate: 1.1% (June 2024 level) | Rate: 1.9% (June 2026 level) |
|---|---|---|
| Monthly repayment | ¥261,003 (approx. USD 1,652) | ¥291,711 (approx. USD 1,846) (+¥30,708 / approx. +USD 194) |
| Annual repayment | ¥3.132 million (approx. USD 19,820) | ¥3.501 million (approx. USD 22,160) (+¥368,000 / approx. +USD 2,329) |
| Repayment ratio (vs. full-occupancy rent of ¥6 million) | 52.2% | 58.3% |
| Repayment ratio (vs. actual income of ¥5.10 million at 85% occupancy) | 61.4% | 68.6% |
| DSCR (NOI of ¥3.473 million ÷ annual repayment) | 1.11 | 0.99 |
| Pre-tax cash flow | +¥341,000 (approx. +USD 2,158) | −¥28,000 (approx. −USD 177) |
DSCR (Debt Service Coverage Ratio) measures how many times over your net operating income covers your annual debt repayment. Once it falls below 1.0, the rental business's own profit is no longer enough to cover the loan. A 0.8-point rate move flips a positive ¥341,000 (approx. USD 2,158) a year into a negative ¥28,000 (approx. USD 177) a year. If you calculate the "repayment ratio should be under 50%" rule of thumb using full-occupancy rent, you will miss this reversal entirely — recalculate it using the actual income at 85% occupancy instead.
Lenders themselves look at DSCR and repayment ratio during underwriting. Being able to produce these figures yourself, before you make an offer, becomes the foundation for negotiating credibly with Japanese financial institutions — a relationship-driven process that international borrowers, used to algorithmic mortgage underwriting back home, often underestimate.
④ Skipping the Repair Reserve: ¥7,000 a Month per Unit Now, or About ¥1.16 Million per Unit in a Lump Sum Later
Choosing not to fund a repair reserve is, in effect, choosing to defer the entire bill into a single lump-sum payment in years 21–25. Laid out in dollars, the choice comes down to two paths.
- Funding a reserve: About ¥7,000 (approx. USD 44) per unit per month. For 20 units, that is ¥140,000 (approx. USD 886) a month, or ¥1.68 million (approx. USD 10,630) a year. Over 25 years that secures ¥2.10 million (approx. USD 13,290) per unit — enough to cover the roughly ¥2.03 million (approx. USD 12,850) per unit needed by year 25.
- Not funding a reserve: You will need about ¥1.16 million (approx. USD 7,340) per unit in years 21–25 — about ¥23.20 million (approx. USD 146,800) per building for 20 units. Without cash on hand, owners typically turn to additional financing, and lenders tend to tighten terms on buildings already past 20 years old.
The ¥7,000 figure is a benchmark that assumes a horizon ending at year 25. MLIT Housing Bureau's "Planned Repair Guidebook for Rental Housing Managers" (賃貸住宅管理業者向け 計画修繕ガイドブック) shows a calculation for a longer horizon: for an 18-unit property with a 35-year plan and ¥95 million (approx. USD 601,000) in total 35-year repair costs, ¥95 million ÷ 420 months works out to ¥226,190 (approx. USD 1,431) a month, or ¥12,566 (approx. USD 79.5) per unit per month. Once you factor in work on a roughly 30-year cycle, such as full water-supply and drain-pipe replacement, the required monthly reserve is nearly double the shorter-horizon estimate.
Source: MLIT Housing Bureau, "Planned Repair Guidebook for Rental Housing Managers" (国土交通省住宅局)
⑤ Mistaking a Sublease "Rent Guarantee" for Fixed Income
A sublease, or master lease (マスターリース), can be a legitimate option once you understand the mechanics — but the failure comes from misreading "rent guarantee" as "income is fixed." First, look at how the contract is actually structured. This is a distinctively Japanese product: unlike a standard US or UK guaranteed-rent scheme, a Japanese sublease inserts the operator as a full intermediary landlord standing between owner and tenant, with statutory rent-reduction rights running in the tenant's favor — a legal mechanic most Western investors have never encountered in their home market.
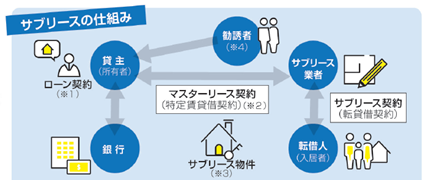
MLIT also publishes real data on the disputes this structure produces. According to the "FY2024 Report on Analysis of the Actual State of the Real Estate Management Industry" (令和6年度 不動産管理業に関する実態分析に係る調査検討業務 報告書, March 2025), only 53.9% of sublease operators reported "no particular trouble" with owners. Flip that around, and roughly 46% of operators report some kind of ongoing dispute with owners. What's more, the content of these disputes is shifting: complaints over "changes in terms, such as rent revisions" are trending up, while disputes over cost-sharing and repairs are trending down — a sign that the real battleground has moved to rent revisions.
The same report also shows that 53.3% of surveyed operators handle "consignment management only," 21.8% handle "both consignment management and sublease," and just 0.8% handle "sublease only" — dedicated sublease-only operators are a small minority.
The Rental Housing Management Business Act addresses this power imbalance by regulating sublease operators directly: a ban on exaggerated advertising (Article 28), a ban on improper solicitation (Article 29), a requirement to explain and deliver contract terms in writing before signing (Article 30), a requirement to deliver documents at the time of signing (Article 31), and a requirement to make records available for inspection (Article 32). As specific examples of "deliberately withholding facts," MLIT names the risk of future rent reductions, the possibility of the operator terminating the contract even mid-term, the fact that an owner can only cancel with "justifiable cause" under the Act on Land and Building Leases (借地借家法, Shakuchi Shakuya Hō), and the owner's liability for large-scale repair costs — and prohibits soliciting an owner by presenting only the benefits while withholding these facts.
The key-facts disclosure document (重要事項説明書) that must be delivered before signing has 14 mandated disclosure items, numbered ① through ⑭. What must appear in it is published in a form you can check against directly.
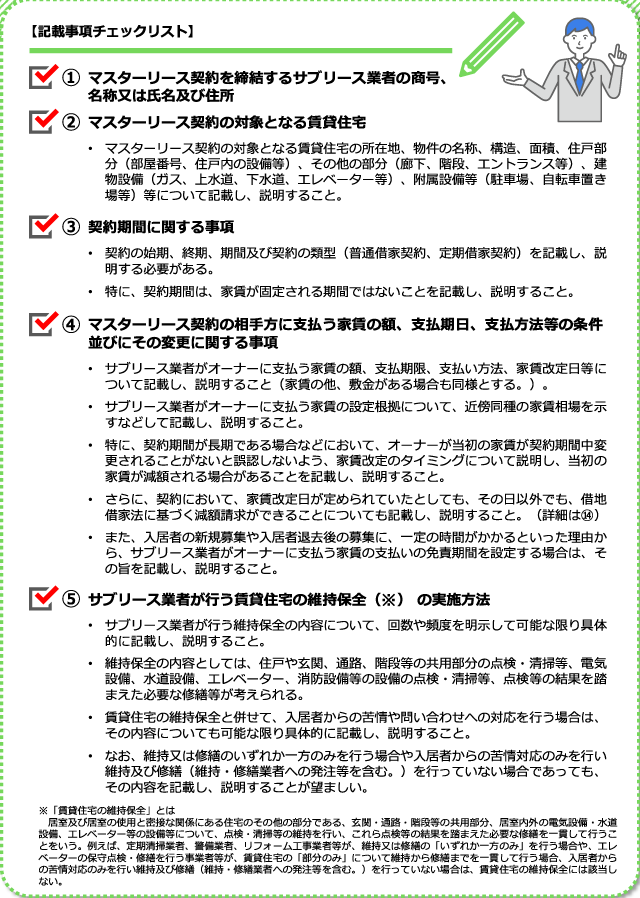
What to check is clear: that the contract term is not a period of fixed rent, the rent-revision date, whether there is a rent-free/liability period, and that a rent-reduction request under the Act on Land and Building Leases can be made even outside the stated revision date. If these four points are not explained to you, do not sign on the spot — take the document home first. We cover the risks that owners most commonly overlook in sublease contracts in a separate article: sublease risks every owner needs to know.
⑥ Choosing a Manager on Fee Alone: A Cheap Fee Usually Just Means a Narrower Scope of Work
Negotiating your management fee down by 1 percentage point is worthwhile — but if the scope of service shrinks by the same amount, it isn't really a discount at all. MLIT's FY2025 survey quantifies the relationship between fee level and scope of service directly.
| Fee rate | 16–20 services | 21+ services | Total, 16+ services |
|---|---|---|---|
| Under 3% (n=55) | 38.2% | 12.7% | 50.9% |
| 3–5% (n=385) | 52.2% | 14.5% | 66.7% |
| 5–10% (n=288) | 45.8% | 17.7% | 63.5% |
Source: MLIT, "Overview of the FY2025 Survey on Rental Housing Management Business" (国土交通省) (the total column is calculated from that document's distribution)
The survey concludes that "managers charging higher fees tend to include more services within their standard fee." Looking at it from the other direction makes the pattern even sharper. Among operators charging under 3%, 20.0% include 10 or fewer services in their standard fee (1.8% include no basic services at all, 5.5% include 1–5, and 12.7% include 6–10); among operators charging 5–10%, that figure is just 5.1%. That's roughly a fourfold gap. When you receive a cheap management quote, ask for a list of exactly what is included in the standard fee and what is billed as an add-on — before you look at the price at all. That list, not the headline number, is where the real decision lives.
⑦ Never Modeling an Exit (Sale) Price: Read Both the Index and the Expected Yield
A cash-flow plan that looks only at holding-period income, without ever modeling a sale price, is running on one leg. According to the latest release of MLIT's "Real Estate Price Index" (published March 31, 2026, covering December 2025 / Q4 2025), the seasonally adjusted national indices stand at 148.0 for residential overall (up 0.5% month-on-month), 225.1 for condominiums (区分所有マンション), 146.6 for commercial real estate overall (down 0.2% quarter-on-quarter), and 176.1 for apartment/multi-unit buildings sold as a whole property (マンション・アパート一棟), up 1.2% quarter-on-quarter. All indices are set to 100 as the 2010 average, and preliminary figures are subject to revision for three months after their first release.
Note also that MLIT has postponed publication of data from January 2026 onward due to a bug in its calculation program (announced July 29, 2026). As of August 2026, the most recent figures available are for December 2025.
Source: MLIT, "Real Estate Price Index" (国土交通省「不動産価格指数」)
An index shows only the market's overall direction. To estimate your own property's exit price, take your projected NOI at the time of sale and divide it by the expected yield for that area — we lay out expected yields by region later in this article.
The Most Common Concern: How to Avoid Failures Caused by the Property Manager
The single most common failure readers ask about is a property manager causing prolonged vacancy and slow follow-up. This is territory where owners tend to rely on gut feel — but the going rate for fees, the legal obligations, and whether a manager is even registered can all be verified through public figures and a free search system. Let's go through each in turn.
The Going Rate for Management Fees: 51.9% Fall Under 3–5% of Monthly Rent
MLIT ran a survey between October 20 and November 6, 2025 (44,203 recipients, 1,473 responses, 886 valid responses). The distribution of management-fee rates as a share of monthly rent came out as follows.
| Fee rate | All respondents (n=742) | 200+ units managed (n=313) | Under 200 units managed (n=398) |
|---|---|---|---|
| Under 3% | 7.4% | 4.2% | 8.8% |
| 3–5% | 51.9% | 57.8% | 48.0% |
| 5–10% | 38.8% | 37.1% | 41.2% |
| 10% or more | 1.9% | 1.0% | 2.0% |
The fee structure itself is also published: "proportional to monthly rent" accounts for 79.1%, "flat fee" for 13.5%, "a combination of proportional and flat fee" for 4.5%, and "no fee charged" for 3.0% (n=876).
Source: MLIT, "Overview of the FY2025 Survey on Rental Housing Management Business" (国土交通省)
Using this table is simple. Pull out your own management contract: if your fee rate is 10% or higher, that puts you in a band only 1.9% of managers occupy. If it is under 3%, you're in the 7.4% band — and, per the previous section, you should confirm whether that low fee also means a narrower scope of service. Simply knowing that the great majority of owners sit in the 3–5% band changes where your negotiation starts. Unlike the flat 8–12%-of-collected-rent norm common among US property managers, Japan's narrower fee band reflects a market where full-service consignment management, rather than pure leasing/collections, is the baseline expectation — worth keeping in mind when comparing a Japanese quote to what you're used to paying at home.
Consignment Management vs. Sublease vs. Self-Management: How Do They Differ?
The choice of management structure comes down not to cost, but to who bears the vacancy risk. Here is a side-by-side comparison of all three.
| Comparison point | Consignment management (管理委託) | Sublease / master lease | Self-management |
|---|---|---|---|
| Cost level | 51.9% of owners pay under 3–5% of monthly rent | Income is the guaranteed rent after the operator deducts its own margin from market rent. That deduction varies by contract, with no published statistical benchmark | Direct costs only — the owner's own time becomes the real cost |
| Income during vacancy | None. Vacancy loss falls on the owner | Contracted rent continues to be paid, though a rent-free (liability) period may apply | None |
| Rent-revision risk | Owner decides based on the market | Operator can request a rent reduction under the Act on Land and Building Leases | Owner decides directly |
| Owner's time commitment | Mainly reviewing reports and making decisions | Lowest | Highest — tenant relations, restoration, arrears collection, all handled personally |
| Legal framework | Consignment management contract under the Rental Housing Management Business Act (key-facts disclosure, segregated fund management, periodic reporting) | Sublease regulation under the same Act (ban on exaggerated advertising and improper solicitation, pre-contract key-facts disclosure) | Outside the Act's registration requirement (since the owner manages directly) |
| Best suited for | One building to a portfolio; remote properties | Situations like a recent inheritance, where hands-off management is wanted for now | Owner lives nearby, few units, has time to spare |
Sublease fee levels are individually negotiated per contract — there is no uniform published statistic. Check the actual level against the key-facts disclosure document and the contract you are given. Thinking about rental management as a business, rather than a passive asset, is the premise behind this whole choice.
Obligations Under the Rental Housing Management Business Act: The One Public Yardstick for Judging a Manager
The Rental Housing Management Business Act (賃貸住宅管理業法, formally the Act on Improvement of Management of Rental Housing Business), which came into full effect in 2021, imposes the following obligations on property managers. This is one of the few objective, institutional yardsticks — rather than a subjective impression — for judging whether a manager is good or bad. It has no direct equivalent in most US or European rental markets, where property-management licensing, where it exists at all, is typically handled state-by-state or left to the real-estate brokerage license rather than a dedicated national framework.
- Registration: Any operator that handles rental-housing management business (maintenance and money management) on consignment must register with the Minister of Land, Infrastructure, Transport and Tourism. However, operators managing under 200 units may register voluntarily.
- Business manager placement: At least one qualified "business manager" (業務管理者), with the required knowledge and experience, must be assigned to each branch or office.
- Key-facts disclosure before signing a management-consignment contract: The specific content and method of the management business must be explained and delivered in writing.
- Segregated fund management: Rent and other funds under management must be kept separate from the operator's own assets.
- Periodic reporting: The operator must periodically report the status of its work to the client.
- Penalties and disciplinary action: Operating a rental-housing management business without registration, among other violations, is punishable by up to one year of imprisonment (拘禁刑, kōkin-kei), a fine of up to ¥1 million (approx. USD 6,330), or both (Article 41). Following a Penal Code amendment effective June 1, 2025 that consolidated imprisonment-with-labor and imprisonment-without-labor into a single "kōkin-kei" category, the statutory text now uses this unified term.
Source: MLIT, Rental Housing Management Business Act Portal Site, "System Overview" (国土交通省) / penalty provisions per e-Gov Japanese Law Search, "Act on Improvement of Management of Rental Housing Business"
One point worth flagging: registration is voluntary for managers with under 200 units. Plenty of small, community-rooted operators do careful, attentive work without registering, so unregistered does not automatically mean bad. That said, MLIT itself states that "even small rental-housing managers with under 200 units are encouraged to register, in order to establish social credibility." Whether the manager can clearly explain why they haven't registered becomes, in practice, the real signal to judge.
A 7-Item Checklist to Confirm Before Signing
When meeting to select or reconsider a property manager, work through the following seven items in order. Every one of them should be something the manager can show you on paper or on screen, on the spot.
- Registration number: Does the operator hold a registration such as "Minister of Land, Infrastructure, Transport and Tourism (○) No. ○○○○"? This is mandatory for anyone managing 200 or more units.
- Disciplinary history: Has the operator ever received a corrective order or a business-suspension order?
- Business manager: Is there at least one qualified business manager (業務管理者) at the branch handling your property? Confirm the name.
- Segregated fund management method: Which account holds rent and other funds, and how is it kept separate from the operator's own assets?
- Frequency and format of periodic reports: Monthly or quarterly? Ask to see a sample and check whether it covers occupancy rate, arrears status, inquiry-handling history, and repair proposals — not just a deposit summary.
- Cost allocation for restoration (原状回復): Which line items are billed to the owner, and which to the departing tenant, in practice?
- Cancellation terms: The required notice period, any penalty fee, and the handover process for tenant data and security deposits. For a sublease, confirm you have received the pre-signing key-facts disclosure document.
Two Free Steps to Check Registration and Disciplinary History
Of the items above, numbers 1 and 2 can be checked yourself, before any meeting at all. It takes about five minutes.
- Check registration status: Enter the company name into MLIT's "Rental Housing Management Business Operator Search" (国土交通省「賃貸住宅管理業者検索」) to confirm whether the operator is registered, its registration number, and its branch locations.
- Check disciplinary history: Use MLIT's Negative Information Search Site (rental housing management operators) to check for any past disciplinary action. If you also want to check a company's history as a licensed real estate broker (宅地建物取引業者), the same site has a separate search for that.
You can run both of these free checks not only before choosing a manager, but on the manager you already use today. The longer it has been since you signed — five years, ten years — the more worth doing this becomes. This kind of no-cost, publicly searchable due diligence on a service provider is a genuine rarity by international standards; treat it as one of the clearest advantages of investing through Japan's regulatory framework rather than around it.
Signs It's Time to Change Managers, and When to Make the Move
Changing property managers affects your tenants too, so it shouldn't be done lightly. If several of the following apply to your situation, it's reasonable to consider starting to compare alternatives.
- Periodic reports don't arrive at all, or contain nothing more than a deposit summary — no leasing activity, no inquiry counts.
- A unit has sat vacant for three months or more, and you have not once received a proposal to adjust the leasing terms (rent, move-in costs, referral fee to brokers).
- You cannot get a reasoned explanation comparing nearby comparable listing rents to the rent set on your own unit.
- When you ask about the basis for a restoration cost-sharing estimate, you get no answer.
- Your management fee is 10% or higher (a level only 1.9% of managers charge) and you cannot get a list of what services that fee actually includes.
- The operator does not show up in the Rental Housing Management Business Operator Search, with no explanation offered for why.
The most realistic time to actually execute a change is a period with low tenant turnover, avoiding the run-up to a major repair project. Your management-consignment contract will specify a required notice period for cancellation — check that first, then work backward from it. Pairing the switch with a rebuilt leasing strategy makes it easier to actually measure whether the change made a difference.
How to Build a Cash-Flow Model That Doesn't Fail: 5 Numbers to Set Conservatively
Now consolidate everything above into a single cash-flow model. The key is to push all five assumptions toward the conservative side at once. Being conservative on only one of them accomplishes little, because bad conditions tend to arrive together.
Which Public Data to Base Each Assumption On
| Assumption | Conservative setting | Public data it's based on |
|---|---|---|
| Occupancy rate | 85% (15% vacancy) | MIC, Housing and Land Survey (estimated ~18.6% from 4.436 million vacant-for-rent units) |
| Interest rate | Stress-test whether you can still service the loan at +1.0 point above today's rate | Bank of Japan, Average Contracted Interest Rates (+0.833 points in two years) |
| Repair cost | Deduct ¥7,000 (approx. USD 44) per unit every month | MLIT, "How Old Is Your Rental Property?" |
| Management fee | 5% (the upper end of the 3–5% band) | MLIT, FY2025 survey |
| Rent decline rate | 0.5% per year | Property-specific — verify individually using asking rents for comparable properties by building age nearby |
The rent-decline rate is the one assumption with no single nationwide public benchmark. Pull actual asking rents for comparable nearby properties at 5, 15, and 25 years of building age, and build your own decline curve from that data. Outsource this one and your entire 20-year cash-flow projection can quietly collapse.
How Far Apart Are the Optimistic and Conservative Scenarios in Actual Take-Home Cash?
Using the same property (¥100 million purchase price, ¥6 million full-occupancy rent, 8 units, ¥80 million loan, 30-year equal-principal-and-interest amortization), compare the outcome when only the assumptions change.
| Item | Optimistic scenario | Conservative scenario |
|---|---|---|
| Occupancy rate | 100% | 85% |
| Interest rate | Held at 1.1% | 1.9% |
| Management fee | 3% | 5% |
| Repair reserve | Not budgeted | ¥7,000/unit/month × 8 units = ¥672,000 (approx. USD 4,250) a year |
| Rent decline | 0% | 0.5% a year (minor impact in year one) |
| Actual income | ¥6.000 million (approx. USD 38,000) | ¥5.100 million (approx. USD 32,300) |
| Net Operating Income (NOI) | ¥5.120 million (approx. USD 32,410) | ¥3.473 million (approx. USD 21,980) |
| Annual loan repayment | ¥3.132 million (approx. USD 19,820) | ¥3.501 million (approx. USD 22,160) |
| Pre-tax cash flow | +¥1.988 million (approx. +USD 12,580) | −¥28,000 (approx. −USD 177) |
The gap is about ¥2.01 million (approx. USD 12,720) a year. Same property, same price — the assumptions alone move the outcome by that much. Sales materials tend to show the left-hand column; what actually happens tends to look much closer to the right-hand one. This isn't a case for dismissing a broker's projection outright — laying your own five-assumption version side by side with theirs is enough, on its own, to change the quality of the decision.
Cross-Checking Your Property Against Regional Expected Yields
Finally, check where your own property's yield sits relative to the broader market. The Japan Real Estate Institute's (一般財団法人 日本不動産研究所, Nihon Fudōsan Kenkyūjo) "54th Real Estate Investor Survey" (第54回 不動産投資家調査, as of April 2026, published May 27, 2026) reports the following expected yields for whole-building rental housing in major survey areas (excerpt).
| Survey area | Studio type | Family type |
|---|---|---|
| Tokyo, Jōnan (south-central) | 3.6% | 3.7% |
| Yokohama | 4.2% | 4.3% |
| Osaka | 4.2% | 4.3% |
| Nagoya | 4.5% | 4.5% |
| Fukuoka | 4.5% | 4.5% |
| Sapporo | 4.9% | 5.0% |
| Sendai | 5.0% | 5.0% |
| Hiroshima | 5.0% | 5.1% |
Source: Japan Real Estate Institute, "54th Real Estate Investor Survey" (as of April 2026). See the original document for the survey's full scope.
It is worth pausing on why a cap-rate survey like this one matters so much in Japan specifically. Unlike the US, UK, or Australia, Japan has no MLS-equivalent public database of actual closed transaction prices for income properties — there is no service where an investor can simply pull up recent comparable sales the way a US buyer would pull comps from an MLS or a UK buyer from the Land Registry. Brokers and investors instead lean heavily on cap-rate (期待利回り) surveys such as this one, published twice a year, to establish fair value. For an international buyer used to transaction-price transparency, this is one of the more disorienting structural differences in the Japanese market — and it is exactly why a benchmark like this survey functions as one of the few standardized, cross-checkable valuation tools available.
There are two ways to use this table. One is to back into an exit price: divide your projected NOI at the time of sale by the area's expected yield. The other is to compare it against the yield on a property you are considering buying. If a listing's yield sits significantly above the market's expected yield, that gap is compensation for risk — and buying without being able to name exactly what risk you're being paid to take on (vacancy? building age? title complications?) is one of the most dangerous ways to buy real estate anywhere, not just in Japan.
Recall the earlier worked example: the property with a 6.0% surface yield came out to a real yield of about 3.5% — almost identical to the 3.6% expected yield for studio units in Tokyo's Jōnan (south-central) area. Read another way: a regional property advertised at a 6.0% surface yield may, once adjusted to real terms, leave an investor with nothing more than the yield an urban Tokyo investor already expects for far less risk.
3 Tax Pitfalls That Cause Failure
Cash flow shows a profit, yet no cash actually accumulates. Much of the time, this comes down to tax structure. Here are three specific pitfalls.
① Choosing a Building Structure Without Knowing Its Statutory Useful Life
Depreciation is the mechanism by which a building's acquisition cost is allocated as an expense over its statutory useful life (National Tax Agency Tax Answer No. 2100). The statutory useful life for residential buildings, by structure type, is as follows.
| Structure | Statutory useful life (residential) |
|---|---|
| Wood-frame / synthetic resin | 22 years |
| Wood-frame with mortar exterior | 20 years |
| Metal-frame (skeleton material ≤3mm thick) | 19 years |
| Metal-frame (skeleton material >3mm to 4mm thick) | 27 years |
| Metal-frame (skeleton material >4mm thick) | 34 years |
| Brick / stone / block construction | 38 years |
| Steel-reinforced concrete / reinforced concrete (SRC/RC) | 47 years |
Source: National Tax Agency, "Table of Useful Life for Major Depreciable Assets" (国税庁)
A wood-frame apartment finishes depreciating in 22 years; a light-gauge steel building (≤3mm) in just 19. A loan, meanwhile, is typically structured over 30 years. The structural fact that 10 years or so of loan balance remains after depreciation ends is exactly what creates the next pitfall.
② The "Dead Cross": Principal Repayment Continues After Depreciation Ends
Depreciation is unusual: it is an expense you can book without any cash actually leaving your account. Principal repayment on a loan is the opposite: cash leaves your account, but it is not booked as an expense at all. When the depreciation period ends, this relationship flips. Book profit — and the tax bill on it — jumps, even as the cash in hand keeps disappearing into principal repayment. This crossover point is what Japanese investors call the "dead cross" (デッドクロス).
The countermeasure is straightforward. At the time of purchase, draw a line on your cash-flow model at the year depreciation ends (year 22 for a wood-frame building) and calculate after-tax cash flow from that year forward. If it turns negative, you can plan ahead of time for options such as accelerated repayment, refinancing, or selling before depreciation runs out. If a sale is on the table, the expected-yield figures from the previous section give you a way to back into a realistic exit price.
③ Interest on Debt Used to Acquire Land Cannot Be Offset Against Other Income
Investors are sometimes told that "even if rental income shows a loss, you can offset it against your salary income and reduce your tax bill." But according to National Tax Agency Tax Answer No. 1391, the portion of a real estate loss attributable to interest on debt used to acquire the land cannot be offset against other income (Article 41-4 of the Act on Special Measures Concerning Taxation, 租税特別措置法第41条の4).
Source: National Tax Agency Tax Answer No. 1391, "Offsetting Other Income Against a Real Estate Loss" (国税庁) / National Tax Agency Tax Answer No. 2100, "Outline of Depreciation" (国税庁)
If you have taken out a full loan covering both land and building and built a cash-flow plan around an assumed tax benefit, this rule can knock out that assumption. The impact is largest for whole-building urban properties where land represents a high share of the price. Because the calculation is highly property-specific, confirm it with a tax accountant before you buy. If you think of rental management as a business rather than a passive holding, the cost of putting a tax professional on your team is simply a necessary business expense.
Even So: Where Is the Value in Running Rental Management as a Business?
Up to this point, this article has laid out, in hard numbers, exactly where failure happens. Some readers may now be thinking, "maybe I should stay out of this altogether." But this was not written to talk anyone out of rental investing.
Every figure in this article was something that could have been checked in advance. The vacancy rate comes from the Ministry of Internal Affairs and Communications. The interest rate comes from the Bank of Japan. Repair costs and management fees come from MLIT. Useful life comes from the National Tax Agency. A manager's registration and disciplinary history can be checked in five minutes. In other words, most apartment-investment failures in Japan do not happen because the information wasn't available — they happen because the decision was made before anyone looked it up.
At INA&Associates, we run our business on the belief that people (人財, jinzai — a term we use deliberately in place of the more common 人材, meaning "human resources"; 財 carries the meaning of "asset" or "treasure," so 人財 literally reads as "people as assets," reflecting our view that people are the company's most valuable holding, not an interchangeable input) are our greatest asset. Rental management runs on the same logic. A property does not generate income on its own — it takes a person thinking about leasing, a person planning repairs, a person answering a tenant's call, before a building can keep producing income at all. The difference between a 3% and a 5% management fee, taken to its logical end, is the difference in how many people a manager can afford to put behind your building. Choose on price alone, and if a vacancy then sits unfilled for six months, the 2 percentage points you saved comes back to cost you many times over.
In my view, the outcome most worth avoiding is not failure itself — it is standing still out of fear of it. What should worry you is not the risk itself, but starting out without ever setting the numbers down. 85% occupancy. Interest rates up 1.0 point. Repairs at ¥7,000 per unit per month. If a property still pencils out after you set all three of those assumptions, then it stands as a real business. A rental-management business begun with that knowledge already in hand can become one that benefits everyone who stays involved with it for the long run.
Frequently Asked Questions (FAQ)
Q. What is the single most common cause of apartment-investment failure in Japan?
Prolonged vacancy, combined with a cash-flow plan that never accounted for it. Simply replacing a 100%-occupancy model with an 85%-occupancy model turns a ¥6 million (approx. USD 38,000) rent roll into a ¥900,000 (approx. USD 5,700) annual shortfall. Japan has 4.436 million vacant rental units nationwide, and 78.5% of vacant multi-unit buildings are rental stock. Set your occupancy assumption at roughly 85% from the very start.
Q. What's a fair management fee? Should I switch to a cheaper manager?
The 3–5% band of monthly rent is the most common, at 51.9% of managers, while only 1.9% charge 10% or more (MLIT, FY2025 survey). That said, among operators charging under 3%, 20.0% include 10 or fewer services in their standard fee — far above the 5.1% figure for the 5–10% band. Don't compare on price alone — line up exactly what services are included in the standard fee at each price point. If the services that vanished are what made the fee cheaper, that isn't really a discount.
Q. What vacancy rate should I use in my model?
Use 85% occupancy (15% vacancy) as your floor assumption. Based on the Ministry of Internal Affairs and Communications' 2023 Housing and Land Survey, dividing 4.436 million vacant-for-rent units by the sum of that figure and 19.462 million rented units gives an estimate of roughly 18.6%. In prefectures with vacancy rates above 20% — Tokushima, Wakayama, Kagoshima, and others — you should set your assumption even more conservatively.
Q. How much should I set aside each month for repairs?
For a reinforced-concrete building funding repairs through year 25, MLIT's benchmark is about ¥7,000 (approx. USD 44) per unit per month. Under a longer, 35-year plan that also covers full water-supply and drain-pipe replacement, the same ministry's guidebook works out to ¥12,566 (approx. USD 79.5) per unit per month. Without a reserve, a 20-unit RC building needs about ¥23.20 million (approx. USD 146,800) per building in a single lump sum in years 21–25.
Q. Can I cancel a sublease contract? Does the rent actually get reduced?
Rent can be reduced under the Act on Land and Building Leases. MLIT requires the key-facts disclosure document to state and explain that the contract term is not a period of fixed rent, and that a rent-reduction request can be made even outside a set revision date. Cancellation initiated by the owner requires "justifiable cause" under the same Act, which is not simple to establish. MLIT's own survey found that only 53.9% of sublease operators report no dispute with owners at all — roughly 46% report some kind of ongoing dispute. Confirm the rent-revision and cancellation clauses only after you have received the pre-signing key-facts disclosure document.
Citations and References
- Statistics Bureau of Japan, "2023 Housing and Land Survey — Basic Tabulation on Housing and Households (Final Tabulation): Summary of Results" (総務省統計局「令和5年住宅・土地統計調査 住宅及び世帯に関する基本集計(確報集計)結果の概要」, published September 25, 2024) | Statistics Bureau of Japan
- Statistics Bureau of Japan, "2023 Housing and Land Survey — Survey Results" (総務省統計局「令和5年住宅・土地統計調査 調査の結果」) | Statistics Bureau of Japan
- Bank of Japan, "Average Contracted Interest Rates on Loans and Discounts (Monthly)" (日本銀行「貸出約定平均金利(月次)」, data through June 2026) | Bank of Japan, Time-Series Data Search Site
- Bank of Japan, explanation of "Average Contracted Interest Rates on Loans and Discounts" statistics (日本銀行「貸出約定平均金利」統計の解説) | Bank of Japan
- MLIT, "Overview of the FY2025 Survey on Rental Housing Management Business" (国土交通省「令和7年度 賃貸住宅管理業務に関するアンケート調査の概要」) | MLIT
- MLIT, Rental Housing Management Business Act Portal Site, "System Overview" (国土交通省 賃貸住宅管理業法ポータルサイト「制度解説」) | MLIT
- "Act on Improvement of Management of Rental Housing Business" (賃貸住宅の管理業務等の適正化に関する法律, Act No. 60 of 2020), full text | e-Gov Japanese Law Search
- MLIT, Rental Housing Management Business Act Portal Site, "Measures for Proper Business Conduct (Sublease)" (国土交通省 賃貸住宅管理業法ポータルサイト「適正化のための措置(サブリース)」) | MLIT
- MLIT, "FY2024 Report on Analysis of the Actual State of the Real Estate Management Industry (Rental Housing Management Business excerpt)" (国土交通省「令和6年度 不動産管理業に関する実態分析に係る調査検討業務 報告書」, March 2025) | MLIT
- MLIT, "Rental Housing Management Business Operator Search" (国土交通省「賃貸住宅管理業者検索」) | MLIT
- MLIT, Negative Information Search Site (rental housing management operators) (国土交通省 ネガティブ情報等検索サイト(賃貸住宅管理業者等)) | MLIT
- MLIT, "How Old Is Your Rental Property?" (国土交通省「あなたの賃貸住宅は何歳ですか?」) | MLIT
- MLIT Housing Bureau, "Planned Repair Guidebook for Rental Housing Managers" (国土交通省住宅局「賃貸住宅管理業者向け 計画修繕ガイドブック」) | MLIT
- MLIT, "Real Estate Price Index" (December 2025 / Q4 2025 data, published March 31, 2026) (国土交通省「不動産価格指数」(令和7年12月・令和7年第4四半期分、2026年3月31日公表)) | MLIT
- Japan Real Estate Institute, "54th Real Estate Investor Survey" (as of April 2026, published May 27, 2026) (一般財団法人 日本不動産研究所「第54回 不動産投資家調査」) | Japan Real Estate Institute
- National Tax Agency, "Table of Useful Life for Major Depreciable Assets" (国税庁「主な減価償却資産の耐用年数表」) | National Tax Agency
- National Tax Agency Tax Answer No. 1391, "Offsetting Other Income Against a Real Estate Loss" (国税庁 タックスアンサー No.1391「不動産所得が赤字のときの他の所得との通算」) | National Tax Agency
- National Tax Agency Tax Answer No. 2100, "Outline of Depreciation" (国税庁 タックスアンサー No.2100「減価償却のあらまし」) | National Tax Agency
- National Institute of Population and Social Security Research, "Household Projections for Japan (National Estimates): 2024 Projections" (国立社会保障・人口問題研究所「日本の世帯数の将来推計(全国推計)令和6(2024)年推計」, published April 12, 2024) | National Institute of Population and Social Security Research
- General Insurance Rating Organization of Japan, "Notice of Revision to Reference Fire Insurance Loss Rates" (損害保険料率算出機構「火災保険参考純率 改定のご案内」, June 28, 2023) | General Insurance Rating Organization of Japan
- General Insurance Rating Organization of Japan, "Reference Fire Insurance Loss Rates" (損害保険料率算出機構「火災保険参考純率」) | General Insurance Rating Organization of Japan